
Who Sits Behind the Ranking: EF EPI 2025 Test-Taker Composition
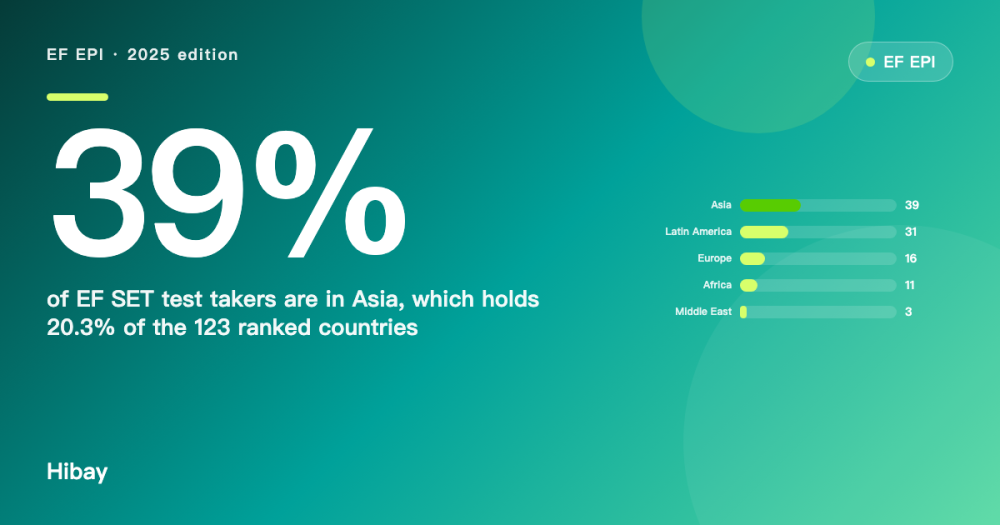
The EF EPI 2025 ranks 123 countries on 2,200,000 tests taken in 2024. The people behind those tests are young, online and concentrated: Asia supplies 39% of test takers from 20.3% of the ranked countries.

On this page
A country's EF EPI score is an average over people who chose to take a free online test, and the index's own methodology pages say so. The 2025 edition rests on more than 2,200,000 EF SET tests taken in 2024 and ranks 123 countries and regions, but those tests are not spread evenly: Asia supplies 39% of test takers while holding 20.3% of the ranked countries. This report describes who sits behind the ranking, using EF's published sample description and composition figures. All numbers are aggregates published by EF, so they cover only the test-taking population and not a whole country.
Key findings
- The 2025 index rests on more than 2,200,000 EF SET tests taken in 2024, grouped into 123 ranked countries and regions: 37 in Europe, 28 in Africa, 25 in Asia, 20 in Latin America and 13 in the Middle East.
- Test takers are concentrated relative to the ranking: Asia accounts for 39% of them against 20.3% of the ranked countries, while Latin America supplies 31% and Europe 16%.
- The sample is young. The average age among respondents who reported a birth year is 26, with 85% under 35 and 99.5% under 60.
- Gender is reported on an incomplete base: female 46%, male 40% and 14% not providing gender information, and a further 10% did not provide a birth year.
Background
The EF EPI is built from the EF SET, a free online adaptive test of reading, listening, speaking and writing that anyone with an internet connection can take. Because participation is voluntary and unpaid, the sample is not a survey design: it is whoever wanted to know their English level, at the moment they wanted to know it. EF says as much in its methodology, and the composition of that group is therefore part of how any national score should be read.
A ranking of countries implies a comparison between populations. What the index actually compares is the test-taking populations of those countries, which differ in size, age, education and access to the internet. Two countries with identical average ability but different sampling could therefore print different scores, and no amount of country-level care corrects for that.
The composition figures also matter for a second reason. A national score is often quoted as if it described a workforce or a school system. The published sample description says something narrower: it describes adults who took a free online test, two thirds of whom are under 35.
Data and method
Source and window. The composition figures come from EF's methodology page for the 2025 index and the facts pages of the 2025 report [1][2]. The tests behind the edition were taken during 2024; national scores are three-year rolling averages, so a published 2025 score blends the current year with the two earlier editions.
Sample. More than 2,200,000 EF SET tests are grouped into 123 ranked countries and regions, split 37 in Europe, 28 in Africa, 25 in Asia, 20 in Latin America and 13 in the Middle East. EF includes a country only with at least 400 test takers and a city only with at least 100. The 2024 sample was 46% female and 40% male, with 14% of respondents not providing gender information; the average age among those who gave a birth year was 26, 85% of them under 35 and 99.5% under 60, and 10% did not give a birth year. Among male respondents the average age was 27 and among female respondents 26. 46% of 2024 test takers completed the exam on a mobile device.
Definitions. The test-taker distribution by continent is EF's own published split of the sample, not a count of the ranked countries. The share of ranked countries is this report's arithmetic: the number of ranked countries in a region divided by 123. All figures are aggregated by country or region, with no individual test-taker record published or used here.
Derived figures. Three values in this report are computed rather than printed: Asia's share of ranked countries, 25 divided by 123 = 20.3%; Europe's 37 divided by 123 = 30.1%; Africa's 28 divided by 123 = 22.8%. The concentration ratio for Asia is 39 divided by 20.3 = 1.92. Each is registered in the accompanying data file.
Results
The concentration is the first thing the numbers show. Asia supplies 39% of test takers, Latin America 31%, Europe 16%, Africa 11% and the Middle East 3%, which sums to the whole sample. Against the ranking's own composition, Asia's 25 countries are 20.3% of the 123, so its share of test takers is 1.92 times its share of ranked places. Europe is the mirror image: 37 countries, or 30.1% of the ranking, supply 16% of the test takers.
The age profile is the second. The average age of respondents who reported a birth year is 26, 85% are under 35 and 99.5% are under 60. That is a sample of young adults, at an age when a test taken for a job application or a visa is most likely, which is consistent with EF's own description of the sample as adults finishing their studies or in early working life. It is not a sample of schoolchildren and not a sample of a whole workforce.
Gender and completeness come third. The published split is 46% female and 40% male, with 14% of respondents not giving gender information, and 10% not giving a birth year. Any gender comparison computed from the index therefore runs on a base that is itself incomplete, and EF notes that the average age of male respondents, 27, is one year above the female average of 26.
Access shows up in the device figure and in the format. 46% of 2024 test takers completed the exam on a mobile device, and the test is free and online, which removes cost as a barrier but not connectivity. EF states that people without internet access are excluded and that this exclusion is strongest where internet use is low.
Two checks sit outside the composition. The 2025 index correlates with TOEFL iBT 2023 scores at 0.74 and with IELTS Academic 2024 scores at 0.61, so the national patterns it reports agree with those of two paid tests with different populations. And the ranking contains no entry for the United Kingdom, the United States, Canada, Australia, Ireland or New Zealand, which is a coverage choice rather than a measurement one but changes what the 123-country list represents.
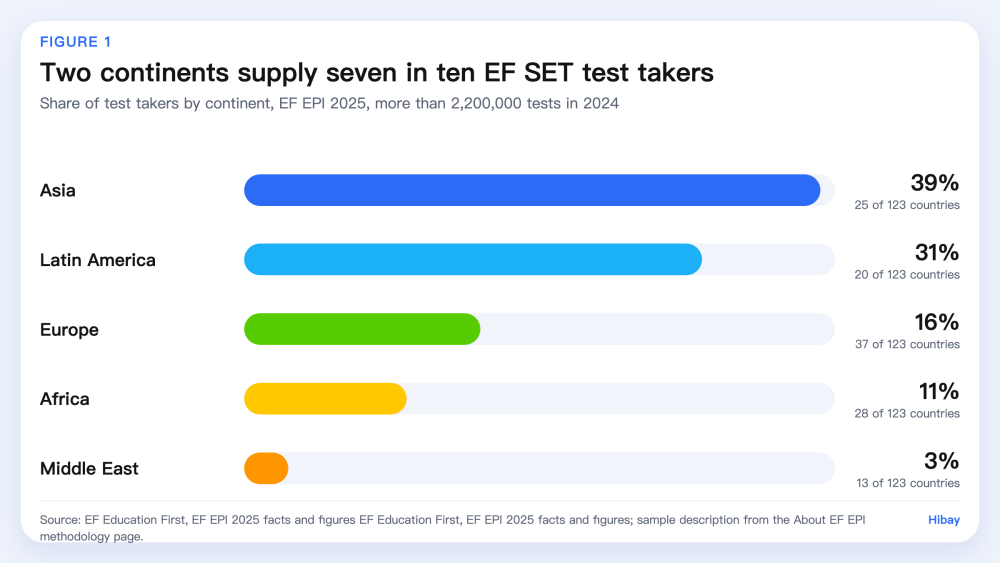
Figure 1. Test-taker distribution by continent behind the EF EPI 2025, per cent of more than 2,200,000 EF SET tests taken in 2024. Source: EF Education First, EF EPI 2025 facts and figures.
Limitations
Four limits apply. First, the sample is self-selected, and EF says the test-taking population may not represent the wider population, so a national score is not a population estimate and can sit above or below the general level. Second, the free online format excludes people without reliable internet, which biases the sample toward better-connected and better-educated respondents, and EF states that this effect is strongest where internet use is low. Third, age and gender are partly self-reported, with 10% of respondents not giving a birth year and 14% no gender, so the published breakdowns rest on incomplete bases. Fourth, the absence of six English-dominant countries means the ranking is a particular subset of the world, and a correlation of 0.74 or 0.61 between national aggregates says nothing about how any individual would score on either test.
What this means for learners
A national EF EPI score is a benchmark against a young, online, self-selected group, not against a country's whole adult population. Comparing yourself with it is reasonable; treating the difference as a verdict on your country's education system is not, because the sample was never designed to measure that.
The composition also suggests what a learner can control. The index measures four skills, and the four do not develop evenly. Test format matters too: nearly half of the 2024 sample tested on a phone, and speaking assessed that way is not the same exercise as speaking in a test centre. Practice on a specific skill, with feedback on that skill, is the part of this that a learner controls; practice feedback is not an official score and Hibay does not issue one.
Frequently Asked Questions
Who actually takes the test behind the EF EPI? Adults who choose to sit a free online adaptive test, mostly young: the average age among those reporting a birth year is 26, with 85% under 35. The 2024 sample was 46% female, 40% male and 14% with no gender given.
Does the EF EPI include the United States and the United Kingdom? Neither appears in the 123-entry 2025 ranking, and neither do Canada, Australia, Ireland or New Zealand. The index covers 123 countries and regions, 37 of them in Europe and 25 in Asia.
Can I convert my TOEFL or IELTS score into an EF EPI score? No. EF reports a correlation of 0.74 between national EF EPI scores and national TOEFL iBT 2023 means, and 0.61 with IELTS Academic 2024 means. Those are relationships between country averages, not a conversion between individual scores.
Why does the average age matter for a country's score? Because the score is an average over the people who took the test, and 85% of those reporting a birth year were under 35. A country whose test takers are unusually young or unusually old is being measured on a different slice of its population.
How to cite
Hibay Product Team. (2026, November 4). Who Sits Behind the Ranking: EF EPI 2025 Test-Taker Composition. Hibay. https://www.hibay.ai/en/news/ef-epi-2025-who-takes-the-test
Figures are from the public sources listed below and may be cited with attribution.
References
- EF Education First. About EF EPI: methodology, sample description and correlations with other tests. https://www.ef.com/wwen/epi/about-epi/. Accessed 2026-11-04.
- EF Education First. EF English Proficiency Index 2025, facts and figures: countries and regions by area, and test-taker distribution by continent. https://www.ef.com/assetscdn/WIBIwq6RdJvcD9bc8RMd/cefcom-epi-site/reports/2025/ef-epi-2025-english.pdf. Accessed 2026-11-04.