
Where IELTS Voices 2026 Test Takers Come From and Plan to Go
In a survey of 8,395 IELTS test takers, ten nationalities supplied 48.7% of respondents, Australia led intended destinations at 18% and planned stays diverged.

On this page
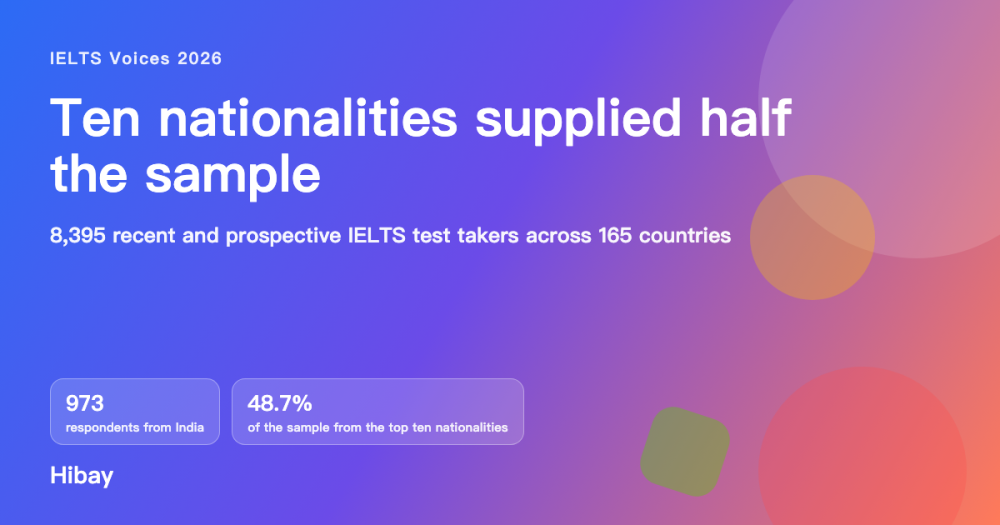
IELTS Voices 2026 surveyed 8,395 recent and prospective IELTS test takers across 165 countries between 19 March and 17 April 2026, and its demographic pages show how concentrated that sample is. India supplied 973 respondents, or 11.6%, and China 713, or 8.5%; the ten largest nationalities together accounted for 48.7% of everyone surveyed. Asked where they intend to use their score, respondents named Australia at 18%, Canada at 17% and the UK at 16%. The report does not print a base for the destination question, and every answer here describes what people said they intended to do.
Key findings
- The ten largest nationalities accounted for 4,087 of the 8,395 respondents, 48.7% of the sample, with India at 973 respondents (11.6%) and China at 713 (8.5%) [1].
- Australia (18%), Canada (17%) and the UK (16%) were the most named intended destinations, ahead of the USA (9%), Germany (6%) and New Zealand (4%); 30% named another country [1].
- India was the largest source market for Canada, at 30% of respondents naming Canada, while Uzbekistan was the largest for the USA (9%) and Nigeria the largest for the UK (9%) [1].
- Among study-purpose respondents, 53% intended to stay three years or more, but the shares diverge by source market: 64% of Indian respondents against 45% of Chinese respondents [1].
- Preparation was rated 7 or higher on a 0-10 helpfulness scale by 68% of study respondents and 68% of work respondents, against 60% of professional registration and 57% of permanent residency or migration respondents [1].
Background
International study and migration decisions are made months before an exam is booked, and the destination usually determines the score a candidate needs. IELTS Voices asks recent and prospective test takers directly about those plans, which makes it one of the few public sources that reports intentions rather than enrollment counts [1]. Because the survey is recruited through test-center networks, the nationality mix of the sample is itself a finding: some source markets supply hundreds of respondents and most supply a handful. This report reads the demographic and destination pages of the 2026 survey, plus the intended-stay and preparation questions that follow them.
Data and method
Source and window. All figures come from IELTS Voices 2026, published by the IELTS partners (the British Council, IDP IELTS and Cambridge University Press & Assessment) [1]. The survey ran online between 19 March and 17 April 2026 and took approximately 15 minutes to complete.
Sample. The sample is 8,395 respondents from 165 countries, recruited through IDP IELTS, British Council and IELTS USA networks. "Recent" respondents had taken IELTS within the past two years and "prospective" respondents planned to take it. Bases differ by question and the report prints them: 8,395 for the demographic and intended-stay questions, and 6,347 for the preparation helpfulness question. The destination question carries no printed base, so its shares are read as a distribution and nothing in this article treats them as a rate per respondent.
Definitions. Intended destination is the answer to "In which country do you intend to use your IELTS score?". Intended stay is the answer to "How long do you intend to stay in your destination country?" and the report labels that column for total study respondents, so the shares describe study-purpose intentions rather than all respondents. Helpfulness is the share answering 7 to 10 on a 0-10 scale.
This article's own sums. The 48.7% concentration figure adds the ten published head counts, which total 4,087, and divides by 8,395; the same method gives 11.6% for India and 8.5% for China. The three-years-or-more shares add the published permanent, five years or more, and three to five years answers for each column. Rounding is to one decimal place for shares of the sample and as printed for the report's own percentages.
Processing. Only published, aggregated survey results are used here; no individual respondent is identifiable. The study design is observational and self-reported.
Results
Ten nationalities account for almost half the sample. India supplied 973 respondents, China 713, Nigeria 415, Pakistan 377 and Viet Nam 353; Indonesia added 314, Uzbekistan 212, Kenya 202 and Türkiye 198. Together those ten groups are 4,087 of the 8,395 respondents, or 48.7%, so conclusions about "IELTS test takers" in this survey are weighted toward a small set of source markets.
| Nationality | Respondents | Share of the 8,395 respondents |
|---|---|---|
| India | 973 | 11.6% |
| China | 713 | 8.5% |
| Nigeria | 415 | 4.9% |
| Pakistan | 377 | 4.5% |
| Viet Nam | 353 | 4.2% |
Shares are this article's own calculation from the published head counts; the report prints the counts and not the shares.
Intended destinations spread across seven options rather than concentrating on one country. Australia took 18%, Canada 17%, the UK 16%, the USA 9%, Germany 6% and New Zealand 4%, and 30% named a country outside that list. The pattern differs by source market: India was the largest source market for Canada at 30% of those naming Canada, Nigeria led the UK column at 9% and sat second for Canada at 13%, and Uzbekistan led the USA column at 9%. India also appeared in the top three for the UK at 8% and for Australia at 9%, level with Kenya at 9%.
Intended length of stay separates the two largest source markets. Across study-purpose respondents, 32% chose three to five years and 12% a permanent stay, so 53% intended to stay three years or more; 29% chose one to two years. Respondents from India intended three years or more 64% of the time, while respondents from China did so 45% of the time, and China's most common single answer was one to two years at 36%. The survey therefore describes two different expectations of the same degree pathway rather than one global pattern.
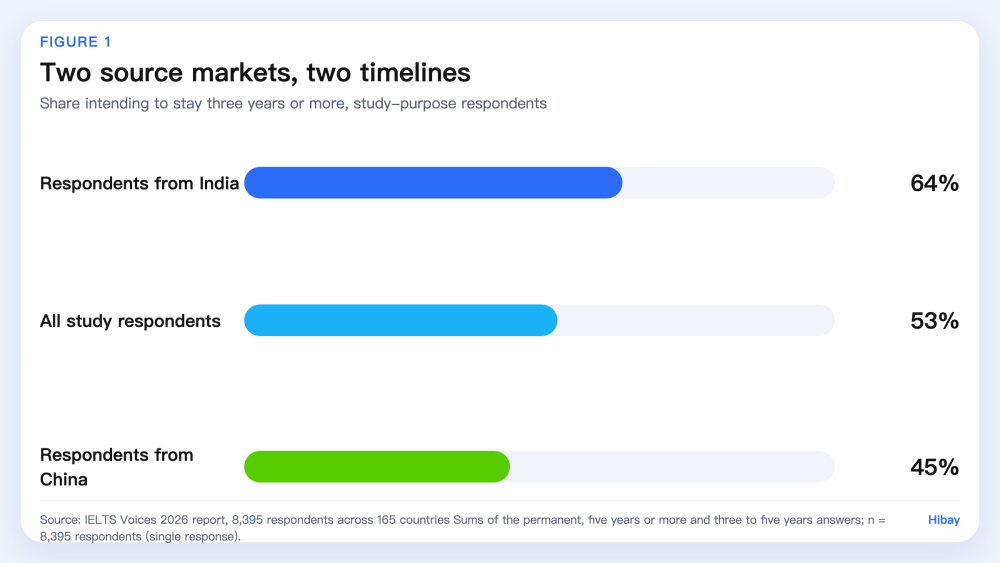
Figure 1. Share of study-purpose respondents intending to stay in their destination three years or more, by source market, n = 8,395 respondents (single response). Source: IELTS Voices 2026, Results 4, p. 16.
Preparation ratings were highest among the respondents whose goal is study or work. On the 0-10 helpfulness question, 68% of study respondents and 68% of work respondents scored preparation 7 or higher, compared with 60% of professional registration respondents and 57% of permanent residency or migration respondents, and 65% across all respondents. The range between the highest and lowest purpose groups is 11 percentage points, which is narrower than the range in intended stay.
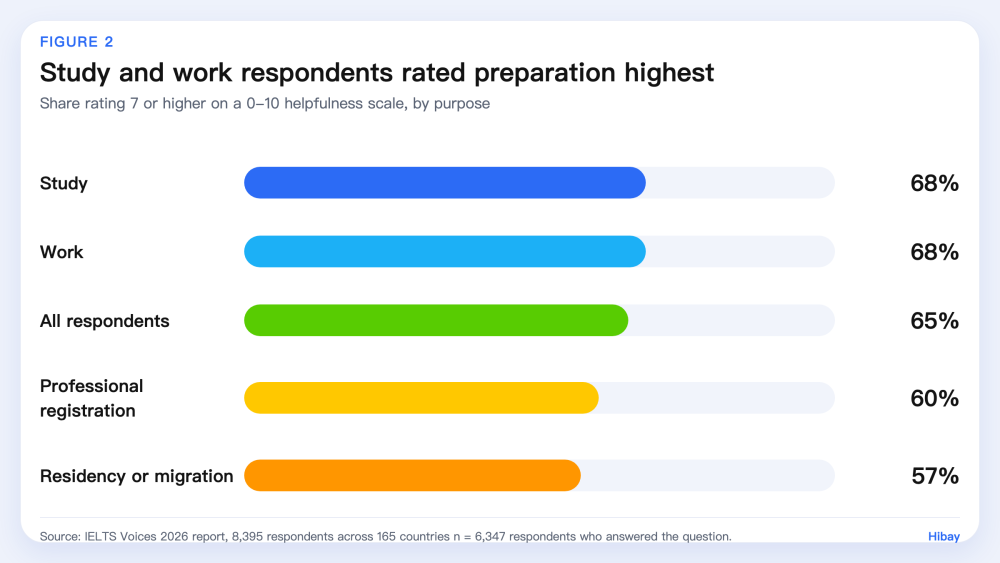
Figure 2. Share rating IELTS preparation 7 or higher on a 0-10 helpfulness scale, by stated purpose, n = 6,347 respondents. Source: IELTS Voices 2026, Results 4, p. 16.
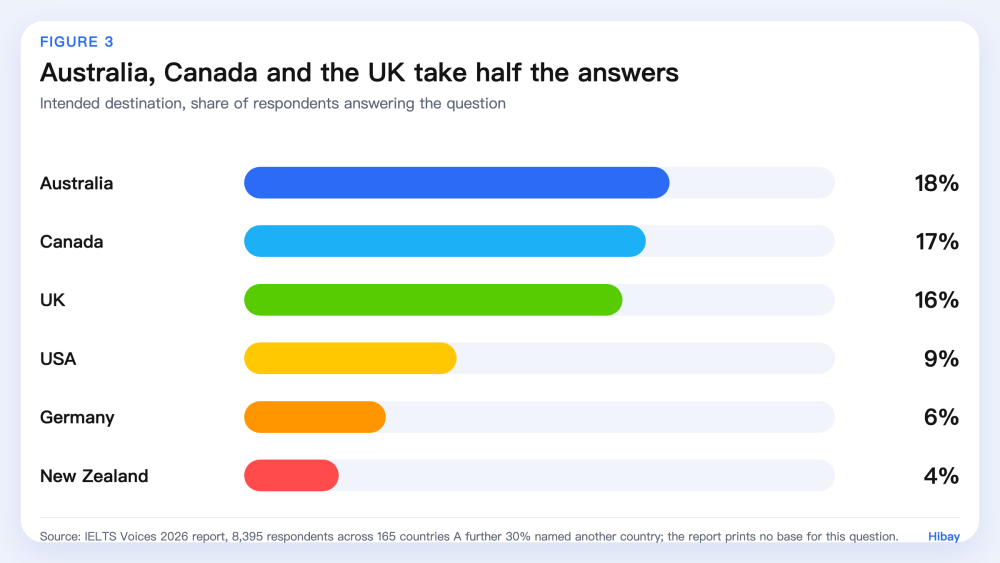
Figure 3. Intended destination of IELTS test takers, share of respondents answering the question, n = base not printed in the report. Source: IELTS Voices 2026, Intended destination, p. 9.
Limitations
Four limits shape these numbers. First, every figure is self-reported: the report states that responses reflect perceptions and intentions rather than measured outcomes, and that plans may differ from eventual choices. Second, respondents are recent or prospective IELTS test takers recruited through test-center networks, not a random sample of English learners, and the concentration described in the Results section means the survey speaks most confidently about a handful of source markets. Third, the destination question carries no printed base, so its shares cannot be converted into counts, and the intended-stay chart is labelled for total study respondents while printing the full survey base, which is why this article reports shares only. Fourth, the survey is a point-in-time snapshot collected in March and April 2026, and visa rules, fee changes and recognition decisions can move those intentions quickly. Nothing here describes what respondents later did.
What this means for learners
Destination plans are more varied than the marketing around any single country suggests: in this survey the three most named destinations together account for about half of respondents, and a third name somewhere else. That makes the score requirement of a chosen destination, rather than a general target band, the useful number to plan around, and it makes speaking practice a reasonable place to spend time because speaking is often the weakest published skill. Practice feedback is a study aid, not an official result; Hibay does not issue IELTS scores.
Frequently Asked Questions
How many test takers answered the IELTS Voices 2026 survey? 8,395 recent and prospective IELTS test takers from 165 countries, surveyed online between 19 March and 17 April 2026 (see Data and method).
Where do IELTS test takers intend to use their score? Australia was named by 18% of respondents, Canada by 17%, the UK by 16%, the USA by 9%, Germany by 6% and New Zealand by 4%, with 30% naming another country. The report prints no base for this question, so the shares are a distribution rather than a count.
Do test takers from different countries plan to stay for the same length of time? No. Among study-purpose respondents, 64% of those from India intended to stay three years or more, against 45% of those from China, where one to two years was the most common single answer at 36%.
Did preparation help, according to respondents? 65% of the 6,347 respondents who answered rated IELTS preparation 7 or higher on a 0-10 helpfulness scale, and the share reached 68% among study respondents and 68% among work respondents. The report does not measure score improvement, so this is a self-reported rating rather than a result.
How to cite
Hibay Product Team. (2026, October 30). Where IELTS Voices 2026 Test Takers Come From and Plan to Go. Hibay. https://www.hibay.ai/en/news/ielts-voices-2026-destinations-and-intended-stay
Figures are from the public sources listed below and may be cited with attribution.
References
- IELTS. IELTS Voices 2026: Insights into the motivations, experiences and outcomes of English language test takers. https://ielts.org/cdn/ielts-downloadable-assets/ielts-research/ielts-research-reports/ielts-voices-2026-research-report.pdf. Accessed 2026-10-30.