
Which TOEFL iBT Section Lags? 2025 Scores by Native Language
Section means for everyone who took the TOEFL iBT test in 2025: Speaking is lowest at 20.6 of 30, but Reading is the weakest section in more language groups.

Auf dieser Seite
How the four TOEFL iBT sections compare is a practical question for anyone planning what to practice. This report reads the section means and percentile ranks that ETS publishes for test takers who took the TOEFL iBT test between January 2025 and December 2025, covering the total group and the 108 native-language groups with published means. Speaking had the lowest section mean, 20.6 of 30, but Reading was the weakest section in more individual language groups than any other section. The figures describe one published window only, and ETS does not report a total examinee count.
Key findings
- Speaking had the lowest section mean of the four in the 2025 total group, 20.6 of 30, against 22.1 in Listening, 21.9 in Reading and 21.2 in Writing [1].
- Reading was the uniquely lowest section in 43 of the 108 native-language groups with published means, against 23 for Speaking and 12 for Writing; Listening was never uniquely lowest [1].
- A scale score of 25 is the 82nd percentile in Speaking but the 57th in Reading and Listening, and Speaking has the narrowest spread of the four sections, at a standard deviation of 4.7 [1].
- Where Speaking is the weak section the gap is concentrated: in Asia it was uniquely lowest in 17 of 30 countries and territories with published means, while in Africa Reading was lowest in 35 of 38 [1].
Background
Section scores matter because ETS reports them separately: each of the four sections is scored on a 0-30 scale, and each range is divided into four or five proficiency levels [2]. Advisers and applicants compare that per-section profile rather than the total, since a program can set a minimum for one section. ETS prints a caution alongside its region tables: it does not endorse ranking countries on the basis of TOEFL scores and describes that use as a misuse of data, because test takers are not representative of all English speakers in a country [1].
Data and method
All figures come from the ETS TOEFL iBT Test and Score Data Summary 2025 and from the ETS score page that explains the section bands [1][2]. The summary covers test takers who took the TOEFL iBT test between January 2025 and December 2025, in ETS wording [1]. It is a set of tables rather than a paper and prints no total examinee count, so no overall sample size can be stated here.
Scores and measures. Each section is scored on a 0-30 scale and the total on a 0-120 scale [1]. A section mean is the average scale score of the group, published to one decimal for the total group and as a whole number for language and country groups. A percentile rank is the share of test takers who scored below a given scale score; the ranks used here are printed by ETS, not converted [1].
Groups and counting. The native-language table lists 142 groups, 108 with published means and 34 marked with an asterisk because the subgroup had fewer than 30 examinees [1]; the native-country table reports the same means under six region labels. Weakest-section counts were produced row by row: for each group with published means I took the minimum of the four section means, counted the group once for the section that was uniquely lowest, and put ties in a separate tied group. Bases: 108 language groups, and countries and territories with published means by region (Africa 38, Americas 27, Asia 30, Europe 43, Middle East 19, Pacific 4).
Aggregation and rounding. The tables are aggregated and no individual test taker is identified. Figures are quoted as published: group means rounded to whole numbers, shares to the nearest whole percent. Rounding means section means may not add up to the printed total.
Results
Speaking is the lowest section across the whole group. For the January-December 2025 window the section means were 21.9 in Reading, 22.1 in Listening, 20.6 in Speaking and 21.2 in Writing, with a total mean of 86 [1]. The highest and lowest sections sit 1.5 points apart on a 30-point scale, and Speaking has the smallest spread, with a standard deviation of 4.7 against 6.6 in Reading, 6.3 in Listening and 4.9 in Writing [1].
| Section | Mean (of 30) | Percentile rank at a scale score of 25 | Native-language groups where uniquely lowest |
|---|---|---|---|
| Reading | 21.9 | 57 | 43 |
| Listening | 22.1 | 57 | 0 |
| Speaking | 20.6 | 82 | 23 |
| Writing | 21.2 | 74 | 12 |
The third column is the share of the total group scoring below 25 in that section; the fourth is a count out of the 108 language groups with published means, and 30 other groups had a tie.
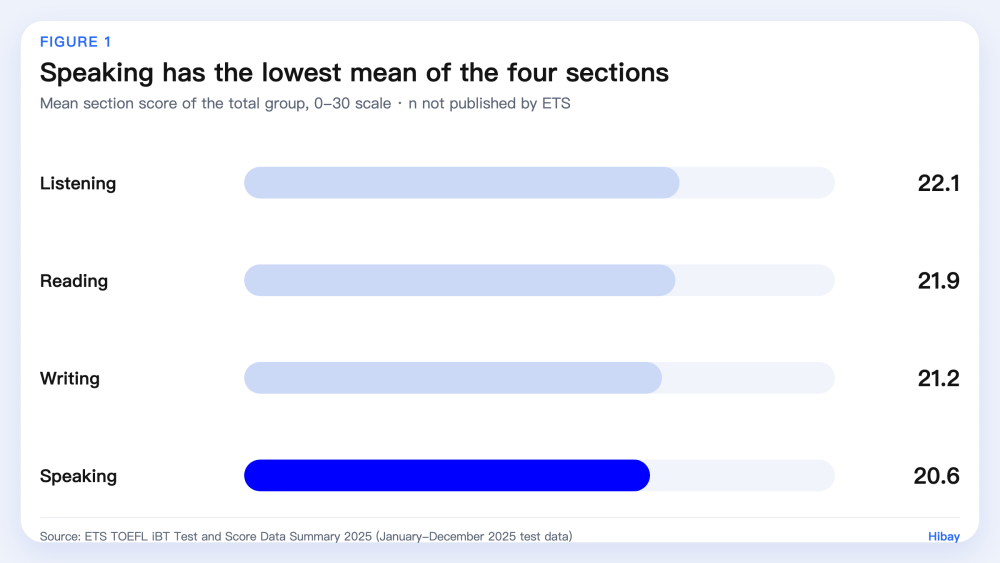
Figure 1. Mean section score of the total group on the 0-30 scale, January-December 2025; n not published by ETS. Source: ETS TOEFL iBT Test and Score Data Summary 2025 [1].
The same score sits at different heights by section. A scale score of 25 is the 82nd percentile in Speaking, against 57 in Reading and Listening and 74 in Writing; at a score of 26 it is 88 in Speaking against 63 in Reading and 64 in Listening [1]. At the top of the scale, 30 is the 99th percentile in Speaking and Writing but the 91st in Reading and the 93rd in Listening [1]. High Speaking scores are reached by a smaller share of test takers, and 25 is where the Advanced Speaking band begins [2].
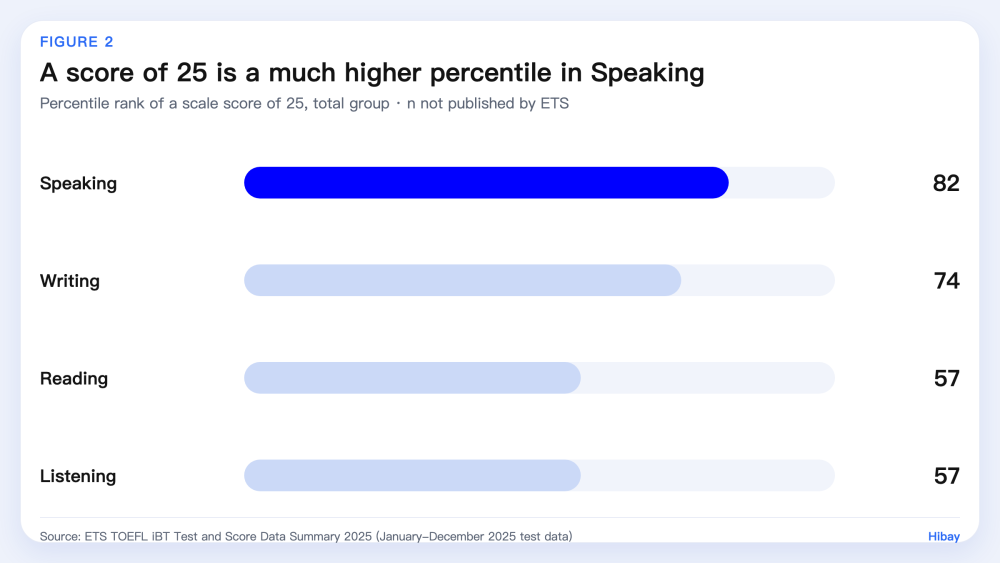
Figure 2. Percentile rank of a scale score of 25 in each section, total group; n not published by ETS. Source: ETS TOEFL iBT Test and Score Data Summary 2025 [1].
Across language groups the ranking changes. Of the 108 groups with published means, Reading was the uniquely lowest section in 43, Speaking in 23 and Writing in 12, Listening never, and 30 groups had a tie at the minimum [1]. In 73 groups the Speaking mean was at or above the Reading mean, and in 45 groups it was at or above every other section mean [1]. The two readings measure different things: the total-group mean averages everyone who tested, while the group counts treat each group as one observation.
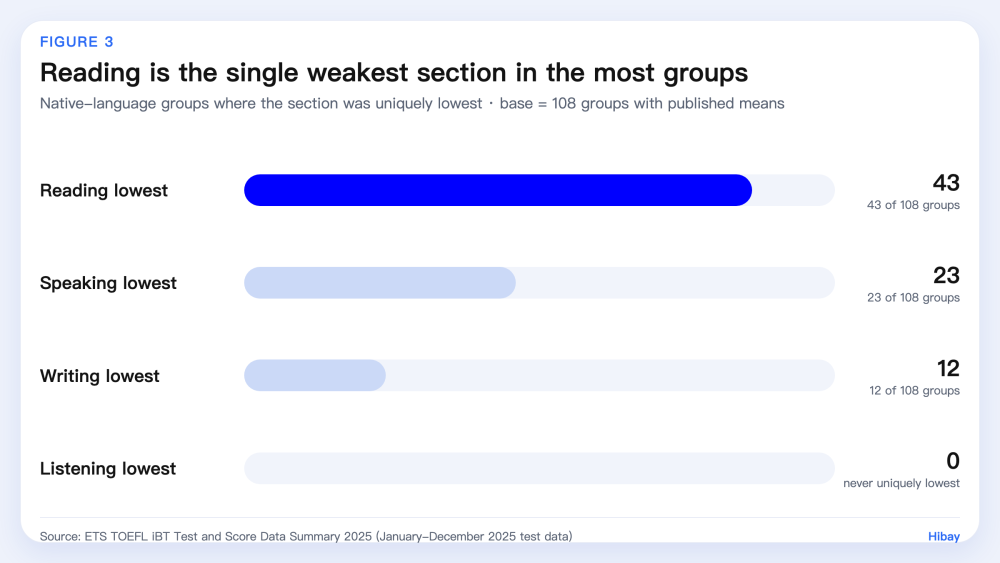
Figure 3. Native-language groups with published means by the section that was uniquely lowest; base = 108 groups, and 30 groups were tied. Source: ETS TOEFL iBT Test and Score Data Summary 2025 [1].
Where Speaking is the weaker section it is often far weaker. Five groups had a Speaking mean at least 5 points below their Reading mean: Vietnamese 13 against 23, Kazakh 13 against 22, Uzbek 15 against 23, Ga 16 against 22 and Telugu 20 against 25, with totals of 76, 71, 79, 81 and 92 [1].
The pattern is uneven by region. Reading was the uniquely lowest section in 35 of the 38 countries and territories with published means in Africa and in 15 of 19 in the Middle East, whereas in Asia Speaking was lowest in 17 of 30 and Reading in 9 [1]. Europe split three ways: Reading lowest in 10 of 43 countries, Writing in 10 and Speaking in 3, with 20 countries tied [1].
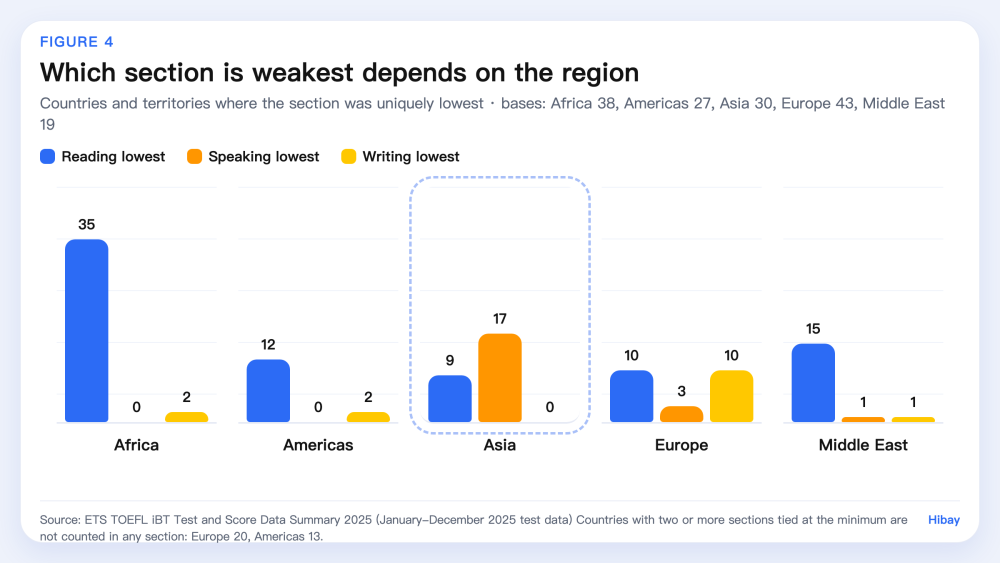
Figure 4. Countries and territories with published means where each section was uniquely lowest, by region; bases 38, 27, 30, 43 and 19. Source: ETS TOEFL iBT Test and Score Data Summary 2025 [1].
Some groups run the other way round. Albanian test takers averaged Reading 19, Listening 22, Speaking 23 and Writing 21, a total of 85, and Spanish-speaking test takers averaged 21, 22, 21 and 20, a total of 84 [1].
Limitations
Five limits apply. First, ETS prints no total examinee count and no count per group, so no sample size can be given here, and the total-group means and the group counts cannot be combined into one weighted statement. Second, 34 of the 142 language groups are suppressed because they contain fewer than 30 examinees, so groups tested by small numbers of people never enter the counts. Third, group means are rounded to whole numbers, so a one-point difference between two sections, or between two groups, sits inside the rounding. Fourth, the data are observational: a section that is lower in one group describes who took the test and how the test scored them in this window, not what a low section is caused by, and ETS itself treats country ranking as a misuse of its tables. Fifth, the window is a single 12-month period, so no year-over-year comparison can be made from this report alone, and nothing here extends to other tests or to English learners in general.
What this means for learners
Read your own score report section by section before deciding where the gap is, because the average and the typical pattern point in different directions: the total-group mean puts Speaking last, while Reading was the uniquely lowest section in more language groups than any other. Use percentile ranks when a program sets a minimum per section, since a 25 in Speaking is the 82nd percentile of the 2025 group and the same score in Reading is the 57th. If Reading is your weakest section, that matches the most common pattern in the published tables. Tools such as Hibay can give repeated feedback on speaking between sessions, but practice feedback is not an official test result.
Frequently Asked Questions
Which TOEFL iBT section has the lowest average score? Speaking, at a mean of 20.6 of 30 in the January-December 2025 total group, below Writing at 21.2, Reading at 21.9 and Listening at 22.1 (see Results).
Is Speaking the weakest section for every group of test takers? No. Reading was the uniquely lowest section in 43 of the 108 native-language groups with published means and Speaking in 23 (see Key findings).
Why is a score of 25 a higher percentile in Speaking than in Reading? Percentile rank depends on how the group scored: 82% of the 2025 total group scored below 25 in Speaking against 57% in Reading, so the same score places a test taker higher in Speaking (see Results).
Do scores differ by native language or region? Yes, and the weakest section shifts: Vietnamese rows print Speaking 13 against Reading 23, Albanian rows print Speaking 23 against Reading 19, and Reading was lowest in 35 of the 38 African countries and territories with published means (see Results).
How to cite
Hibay Product Team. (2026, October 30). Which TOEFL iBT Section Lags? 2025 Scores by Native Language. Hibay. https://www.hibay.ai/en/news/toefl-section-scores-by-native-language-2026
Figures are from the public sources listed below and may be cited with attribution.
References
- ETS. TOEFL iBT Test and Score Data Summary 2025. https://www.es.ets.org/content/dam/ets-org/pdfs/toefl/toefl-ibt-test-score-data-summary-2025.pdf. Accessed 2026-10-30.
- ETS. Scores for the TOEFL iBT Test. https://www.ets.org/toefl/teachers-advisors-agents/ibt/scores.html. Accessed 2026-10-30.