
TOEFL iBT 2024: National Means Run From 58 to 102
ETS 2024 data: national mean TOEFL iBT totals run from 102 in Austria to 58 in Lao PDR, a 44-point spread, while some countries hold a total near the average with a speaking score far below it.

On this page
ETS 2024 data: national mean TOEFL iBT totals run from 102 in Austria to 58 in Lao PDR, a 44-point spread, while some countries hold a total near the average with a speaking score far below it.
The TOEFL iBT test and score data summary for 2024 reports a national mean total for every country or region with at least 30 examinees, and those means span 44 points. Austria averages 102 of 120, the highest in the table, while Lao People's Democratic Republic averages 58, the lowest. The spread is not only about overall level: some countries hold a total close to the all-examinee average of 86 while recording a speaking mean far below their own standing. The figures are group means published by ETS for examinees by native country, so they describe test takers, not national populations.
Key findings
- Austria recorded the highest national mean total in 2024 at 102, made up of Reading 25, Listening 27, Speaking 26 and Writing 24.
- Lao People's Democratic Republic recorded the lowest national mean total at 58, with Reading 11, Listening 13, Speaking 17 and Writing 16.
- The distance between the highest and lowest national mean, 102 and 58, is 44 points.
- Across all 2024 examinees the mean total was 86 with a standard deviation of 19, and section means were 21.9 for Reading, 22.1 for Listening, 20.7 for Speaking and 21.1 for Writing.
- Some countries sit at or above the all-examinee average overall while their Speaking mean falls far below it: Uzbekistan averaged 86 overall but 12 in Speaking, Viet Nam averaged 74 with Speaking at 12, and Kazakhstan averaged 73 with Speaking at 15.
Background
TOEFL iBT scores are accepted by more than 12,500 colleges, universities and licensing agencies in more than 160 countries, and the test is also used by governments and scholarship programs [1]. Because the score is read by so many institutions, a national average is a useful benchmark for anyone comparing their own result against the pool they are competing with. The 2024 summary is published annually by ETS with percentile tables and means by country and native language, and its country table is the one this report uses.
Data and method
All figures come from the Test and Score Data Summary for the TOEFL iBT Tests, 2024, published by ETS [1]. The data cover tests taken between January and December 2024. The country table reports the mean Reading, Listening, Speaking and Writing score and the mean total for all examinees classified by native country or region, and ETS does not report means for any subgroup below n=30 examinees, marking those cells with an asterisk. Percentages and counts in this report are whole numbers; section and total means keep the decimals as published, and because ETS rounds, a country's section means may not add exactly to its published total.
Two definitions matter. A national mean here is the average score of the examinees whose native country is that country, so it is a property of that country's test takers and not of its population or its education system. The spread of 44 points is the highest national mean total minus the lowest, computed from the published two-decimal table values. Means and standard deviations for the total group come from the percentile table, which reports every scale score for all 2024 examinees regardless of country. Results are aggregated by country and no individual score record is published, and no group below the 30-examinee threshold appears in the figures.
Results
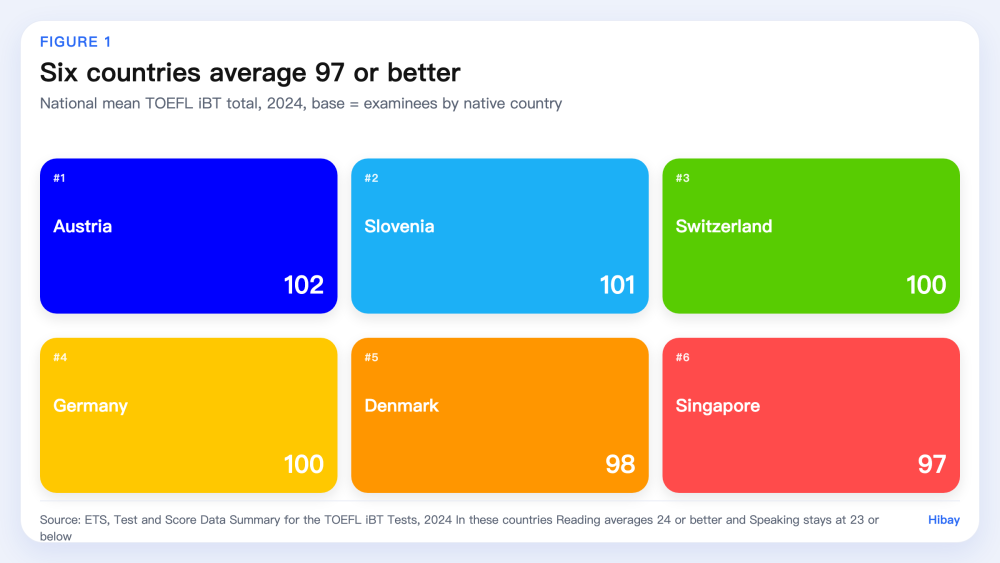
The top of the table is a tight cluster of high-scoring countries. Switzerland averages 100, Slovenia 101, Denmark 98, Iceland 98, Luxembourg 98, Singapore 97, the Netherlands 97, Sweden 97 and New Zealand 97, all of them within a few points of Austria's 102. Reading and listening carry most of those totals: in the highest-scoring countries the average Reading score is 24 or better while the average Speaking score stays at 23 or below.
| Country | Total | Reading | Listening | Speaking | Writing |
|---|---|---|---|---|---|
| Austria | 102 | 25 | 27 | 26 | 24 |
| Slovenia | 101 | 25 | 27 | 25 | 24 |
| Switzerland | 100 | 25 | 26 | 25 | 24 |
| Germany | 100 | 24 | 26 | 26 | 24 |
| Singapore | 97 | 24 | 25 | 24 | 24 |
| Lao PDR | 58 | 11 | 13 | 17 | 16 |
Each row is one country's mean for its own examinees in 2024; a country's section means may not add to its total because ETS rounds.
*Figure 1. Highest national mean TOEFL iBT total scores, 2024, base = examinees by native country with at least 30 examinees. Source: ETS TOEFL iBT Test and Score Data Summary 2024 [1].*
The bottom of the table is further from the middle than the top. Togo, Côte d'Ivoire and Congo each average 59, Burkina Faso and Timor-Leste 60, and Lao PDR 58, while the all-examinee mean is 86. Put differently, the gap from the lowest national mean to the overall mean is 28 points, larger than the 16-point gap from the overall mean to the highest national mean.
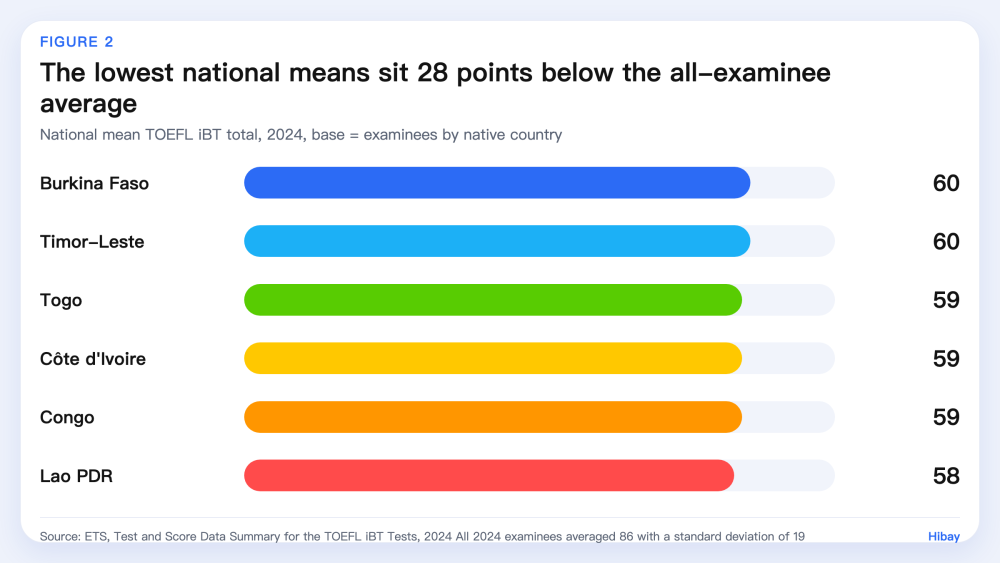
*Figure 2. Lowest national mean TOEFL iBT totals, 2024, base = examinees by native country with at least 30 examinees. Source: ETS TOEFL iBT Test and Score Data Summary 2024 [1].*
The most striking feature of the table is where speaking sits. Uzbekistan's mean total of 86 is exactly the all-examinee average, yet its Speaking mean is 12. Viet Nam averages 74 overall with Speaking at 12, and Kazakhstan averages 73 with Speaking at 15. In each case Reading and Listening are unremarkable and the speaking score pulls the profile down sharply. The reverse also happens: some countries with mid-table totals hold speaking scores at or above the overall speaking mean of 20.7.
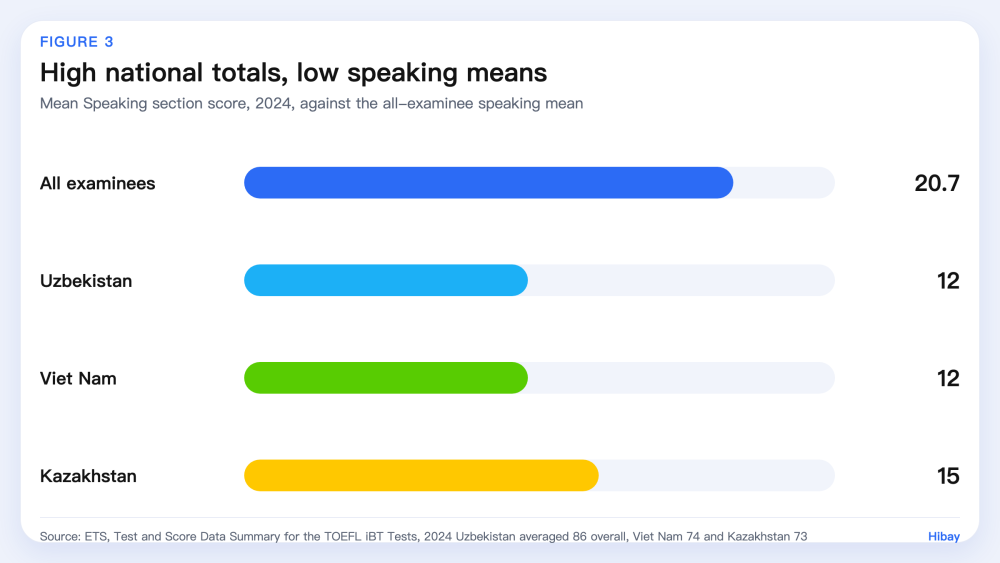
*Figure 3. Speaking section means for three countries whose total and speaking profiles diverge, against the all-examinee speaking mean, 2024. Source: ETS TOEFL iBT Test and Score Data Summary 2024 [1].*
The dispersion around the average explains why single numbers mislead. The standard deviation of the total score across all 2024 examinees is 19 points, and the section standard deviations run from 4.6 for Writing and Speaking to 6.5 for Reading and 6.2 for Listening. Speaking and Writing vary least, which is consistent with a section where a large share of examinees lands in a narrower band of scores.
Limitations
Four limits apply. First, ETS publishes means by native country, not for national populations: an examinee's country is a self-reported attribute, and the group taking the test in any given country is whoever needed an English certification that year, so these are not measures of national English proficiency. Second, ETS suppresses every subgroup smaller than 30 examinees, so countries with small test populations are absent rather than low, and a country's appearance in the table depends on test volume as much as on scores. Third, the table reports means only, without the underlying distributions, so a country mean of 86 can hide both a uniform group and a split one, and ETS rounds its values, which means small differences between countries should not be treated as real. Fourth, these are observational group statistics for a single test year: nothing here shows that any curriculum, teaching method or test preparation produced a country's score, and the 2024 window cannot distinguish a trend from a one-year fluctuation.
What this means for learners
A national mean is a comparison point, not a target. The useful reading is the shape of the profile: in the highest-scoring countries the strongest sections are Reading and Listening, while Speaking is the section where both the top and the bottom of the table lose the most ground, and where some high-total countries fall to 12. If your own practice record shows reading and listening far ahead of speaking, that is the common shape in this data, and speaking is also the section that is hardest to rehearse alone because it needs a listener and feedback. Institutions usually publish a minimum total and sometimes a minimum per section, so checking a section requirement before booking is worth the two minutes it takes. Hibay offers speaking practice and feedback between study sessions, though its feedback is not an official TOEFL score and does not predict a result on the test.
Frequently Asked Questions
What is the highest average TOEFL score by country?
In the 2024 ETS table, Austria has the highest national mean total at 102, followed by Slovenia at 101 and Switzerland and Germany at 100 (see Key findings).
What is the lowest average TOEFL score by country? Lao People's Democratic Republic has the lowest national mean total at 58, with Togo, Côte d'Ivoire and Congo at 59 and Burkina Faso and Timor-Leste at 60 (see Results).
Why is speaking so much lower in some countries? The data show the pattern but not the reason: Uzbekistan, Viet Nam and Kazakhstan all hold Speaking means between 12 and 15 while their Reading and Listening means are ordinary. The ETS table contains no information on test preparation, access to English-speaking environments or section requirements at destination institutions, so any explanation would be speculation (see Limitations).
Is a country average a good benchmark for my own score? Only partly. Country means pool everyone who tested from that country in a year, including first-time and repeat examinees, and ETS does not publish the distributions behind them, so the mean tells you where the middle sits without telling you how close to the middle most people are (see Limitations).
How to cite
Hibay Product Team. (2026, November 4). TOEFL iBT 2024: National Means Run From 58 to 102. Hibay. https://www.hibay.ai/en/news/toefl-2024-country-score-spread
Figures are from the public sources listed below and may be cited with attribution.
References
- Educational Testing Service (ETS). Test and Score Data Summary for the TOEFL iBT Tests, 2024. https://www.ets.org/pdfs/toefl/toefl-ibt-test-score-data-summary-2024.pdf. Accessed 2026-11-04.