
IELTS Band Spread by Test Reason: 2024-2025 Official Statistics
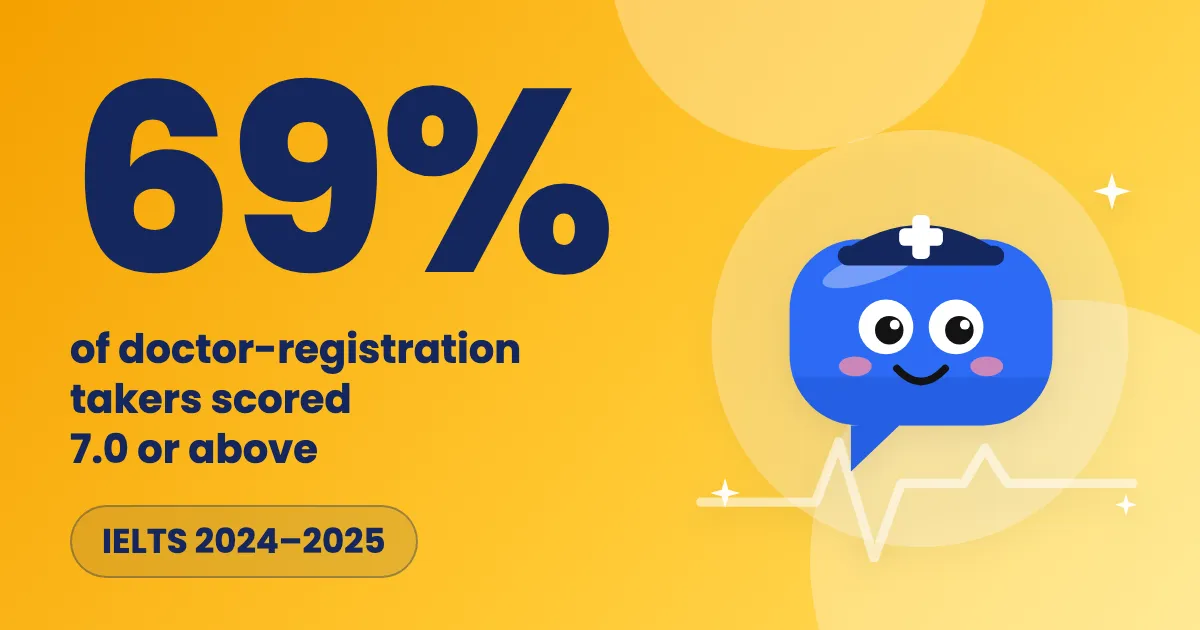
Official IELTS 2024-2025 tables by reason for testing: 69% of doctor-registration takers scored 7.0 or above; nurse-registration takers cluster at 6.0 to 6.5.

On this page
Do test takers who sit IELTS for different reasons land in different parts of the band scale? This report reads the official IELTS statistics for reason for taking the test, published for 2024-2025: 11 reason groups for Academic and 11 for General Training test takers, each split across the 12 band columns that run from Below 4 to 9 [1]. The widest spread appears at the top of the scale: 69% of Academic test takers registering as doctors scored 7.0 or above, against 24% of those citing personal reasons. The published tables carry shares only, with no head count for any reason group.
Key findings
- In the 2024-2025 Academic tables, 69% of test takers who gave registration as a doctor as their reason scored 7.0 or above, the highest share of the 11 reason groups, against 24% of those citing personal reasons.
- Registration as a nurse is the most middle-heavy Academic group: 45% of its test takers scored 6.0 or 6.5, while a further 44% scored 7.0 or above.
- Immigration is the one reason where the Academic and General Training distributions nearly coincide: 43% against 41% at 7.0 or above, and 36% against 39% at 6.0 or 6.5.
- General Training test takers citing a short higher education course were the most bottom-heavy of the 11 reason groups in either table: 50% scored below 6.0, against 39% of the same reason group in Academic.
Background
IELTS publishes annual statistics on how its test takers score, cut by age, reason for taking the test, first language and nationality [2]. The reason tables are the only cut that groups candidates by what they intend to do with the result rather than by who they are, and both versions share one 9-band scale [2]. That makes the two reason tables the cleanest published comparison of where different purposes sit on the band scale.
Data and method
Source and window. This report uses the IELTS demographic data workbook for 2024-2025, worksheets AC reasons for taking IELTS and GT reasons for taking IELTS [1]. The IELTS test statistics page describes the data set as the percentage of test takers achieving different scores, split by age, reason for taking the test, first language and nationality [2].
Sample and inclusion. Each row is one reason group, and both worksheets carry the same 11 reasons, from For employment through the registration rows to (Other). The two test versions are never combined. No counts are published: the workbook reports each reason group's share in each band column and nothing about how many people a group contains, so this report describes distribution shape only.
Definitions. Every cell is the share of one reason group that scored in one band column, so the denominator of each row is all test takers in that reason group and the published row sums to 1. These are shares of the official score distribution for that group, not head counts. Three aggregates are used below. Below 6.0 adds the Below 4, 4, 4.5, 5 and 5.5 columns. The middle band adds the 6 and 6.5 columns, written here as 6.0 to 6.5. The top band adds the 7, 7.5, 8, 8.5 and 9 columns, written here as 7.0 or above. Each aggregate is our own arithmetic on the published columns, applied row by row inside one worksheet.
Processing. Values are read from the published workbook and rounded for presentation only, with no re-weighting or interpolation. The source is itself an aggregated, anonymized publication, so no minimum cell size threshold is applied. Figures are rounded to the nearest whole percent.
Results
The top of the scale is where the reason groups separate most. Registration as a doctor put 69% of its Academic test takers at 7.0 or above, with only 20% in the 6.0 and 6.5 columns. Professional registration other than medical followed at 58%, then registration as a dentist at 49%, registration as a nurse at 44% and immigration at 43%. Employment sat at 39%, and the lowest top-band shares belonged to a long higher education course at 26%, personal reasons at 24% and a short higher education course at 24%.
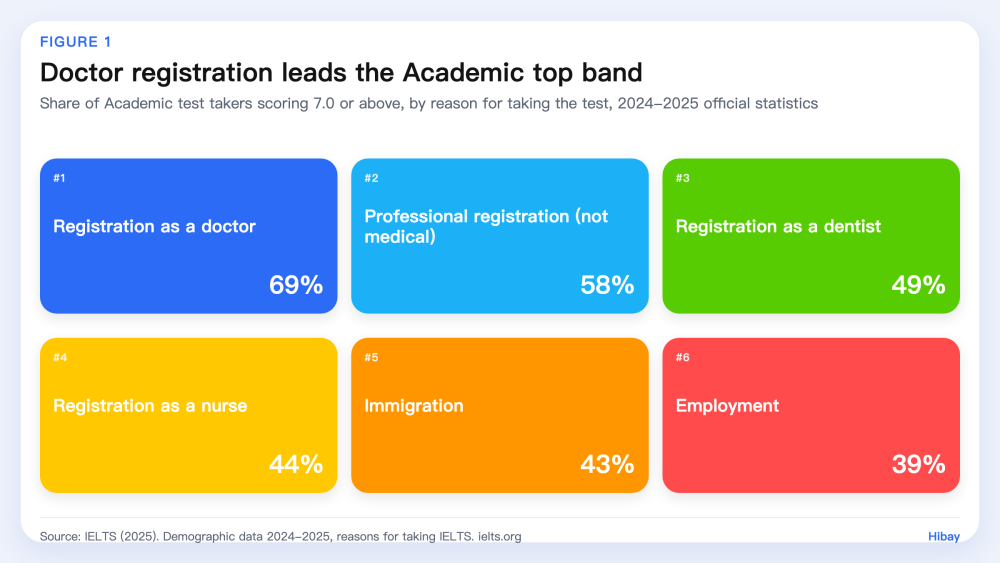
Figure 1. Share of Academic test takers scoring 7.0 or above, by reason for taking the test, 2024-2025 official statistics: registration as a doctor 69%, professional registration other than medical 58%, registration as a dentist 49%, registration as a nurse 44%, immigration 43%, employment 39% (11 reason groups, 12 band columns per table; no per-group counts published). Source: IELTS demographic data 2024-2025 [1].
The middle of the scale reverses that order. Registration as a nurse placed 45% of its Academic test takers in the 6.0 and 6.5 columns, the largest middle-band share of the 11 groups, with only 11% below 6.0. A long higher education course followed at 41%, personal reasons at 40%, other education purposes at 39%, employment at 38% and immigration at 36%. For those groups the 6.0 to 6.5 band is not a stop on the way to a higher score: it is where the largest share of the group sits.
| Reason (Academic test) | Below 6.0 | 6.0 to 6.5 | 7.0 or above |
|---|---|---|---|
| Registration as a doctor | 11% | 20% | 69% |
| Registration as a nurse | 11% | 45% | 44% |
| Immigration | 21% | 36% | 43% |
| Employment | 23% | 38% | 39% |
| Personal reasons | 36% | 40% | 24% |
Read across a row: the three columns are shares of one reason group and add to roughly 100%. Rows are ordered by top-band share, so the table shows the trade-off between the middle and the top of the scale.
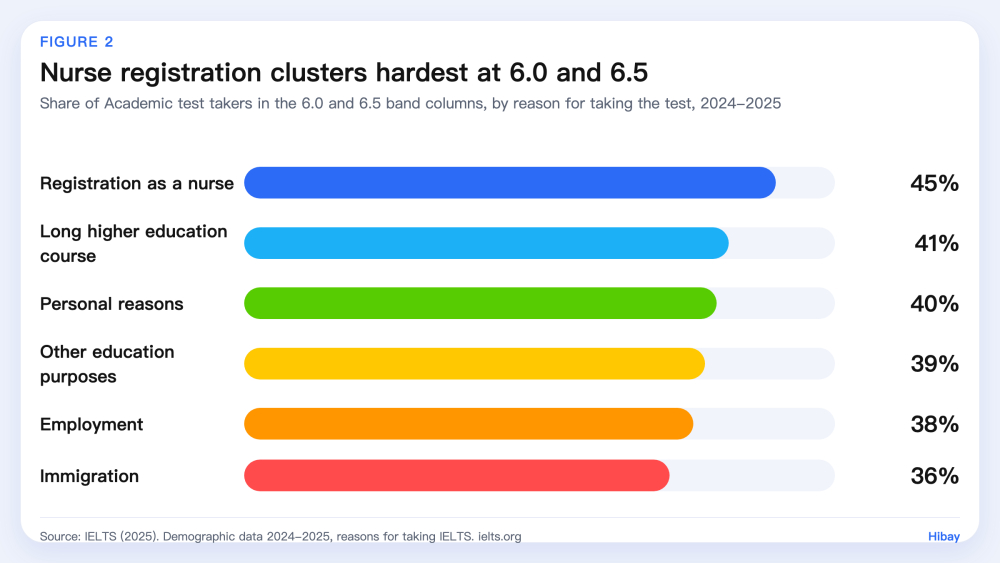
Figure 2. Share of Academic test takers in the 6.0 and 6.5 band columns, by reason for taking the test: registration as a nurse 45%, a long higher education course 41%, personal reasons 40%, other education purposes 39%, employment 38%, immigration 36% (11 reason groups, 12 band columns per table; no per-group counts published). Source: IELTS demographic data 2024-2025 [1].
Splitting the same reason by test version changes the picture, except for immigration. Immigration is the only reason where the Academic and General Training tables nearly coincide: 43% against 41% at 7.0 or above, and 36% against 39% at 6.0 or 6.5. Employment does not behave that way: 39% of Academic test takers giving employment scored 7.0 or above, against 24% of General Training test takers, and 23% against 43% scored below 6.0. A long higher education course points in the same direction at a smaller size: 33% below 6.0 in Academic against 48% in General Training.
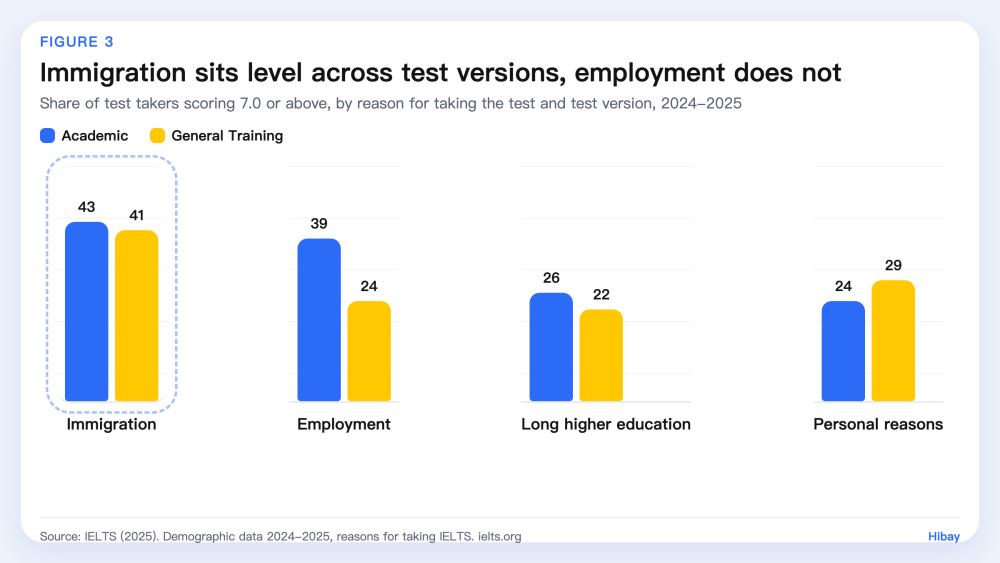
Figure 3. Share scoring 7.0 or above by reason for taking the test and test version, 2024-2025: immigration 43% Academic against 41% General Training, employment 39% against 24%, a long higher education course 26% against 22%, personal reasons 24% against 29% (11 reason groups, 12 band columns per table; no per-group counts published). Source: IELTS demographic data 2024-2025 [1].
General Training's most bottom-heavy reason group was a short higher education course: 50% of those test takers scored below 6.0 and only 18% reached 7.0 or above, where the same reason in Academic put 39% below 6.0 and 24% at 7.0 or above. The registration rows do not all move in one direction. Registration as a doctor was 69% at 7.0 or above in Academic and 57% in General Training, professional registration other than medical was 58% against 45%, and registration as a dentist was 49% in Academic against 51% in General Training.
Limitations
Four limits shape what these shares can carry. First, the workbook publishes shares only, so no reason group can be weighted by size: a group with a smaller top-band share may still account for more test takers at 7.0 or above than a group with a larger one, and the tables cannot show that. Second, reason for taking the test is self-reported, one reason is recorded per test taker, and the categories are broad: personal reasons and other education purposes each mix different motives. Third, the numbers are observational: a higher share at 7.0 or above is associated with a reason group, not evidence that the reason itself, or any preparation behind it, changed a score, and the tables do not control for first language, nationality or age. Fourth, the workbook covers the 2024-2025 reporting year only, and Academic and General Training candidates also differ in which institutions accept each version, so the two tables are not interchangeable populations.
What this means for learners
Two practical readings follow. First, check your target against the middle of the scale: if you are taking Academic for immigration, 43% of that group reached 7.0 or above, so a 7.0 target sits inside the upper part of the published distribution rather than at its edge, while for personal reasons only 24% reached it. Second, read the group you are actually in, not the other table: General Training employment takers cluster lower than Academic ones, 24% against 39% at 7.0 or above. Hibay practice feedback is a practice signal, not an official score, and nothing here predicts an individual result.
Frequently Asked Questions
Do IELTS scores differ by reason for taking the test? Yes. In the 2024-2025 Academic table the share scoring 7.0 or above runs from 24% for personal reasons to 69% for registration as a doctor [1]. The ordering is not simply medical against non-medical: registration as a nurse sits at 44%, just above immigration at 43%.
Which reason group scores highest on IELTS? In the Academic 2024-2025 table, test takers giving registration as a doctor had the largest share at 7.0 or above, 69%, followed by professional registration other than medical at 58% [1]. Both are registration-driven groups, which is consistent with a band threshold being part of a registration requirement, although the tables cannot show that.
Does this mean Academic is harder than General Training? The tables do not measure difficulty. They show that the distributions differ by reason and by version: for immigration the two versions nearly match, 43% against 41% at 7.0 or above, while for employment Academic sits at 39% against 24% in General Training [1].
Why do the tables not show how many people took the test for each reason? The published workbook reports the share of each reason group in each band column and nothing else [1]. That is why this report describes distribution shape and reports no counts per reason.
How to cite
Hibay Product Team. (2026, October 30). IELTS Band Spread by Test Reason: 2024-2025 Official Statistics. Hibay. https://www.hibay.ai/en/news/ielts-band-distribution-by-test-reason-2026
Figures are from the public sources listed below and may be cited with attribution.
References
- IELTS. IELTS demographic data 2024-2025 (XLSX, worksheets AC reasons for taking IELTS and GT reasons for taking IELTS). https://ielts.org/cdn/ielts-downloadable-assets/ielts-research/ielts-research-data/ielts-demographic-data-2024-2025.xlsx Accessed 2026-10-30.
- IELTS. Test statistics. https://ielts.org/teaching-and-research/test-statistics Accessed 2026-10-30.