
IELTS Band Shares by First Language: 2024-2025 Official Tables
Official IELTS band distributions for 40 first-language groups: the Academic share at 7.0 or above runs from 14.2% to 88.0%, with no group mostly below 6.0.

On this page
The official IELTS demographic data for 2024-2025 prints the overall band distribution of test takers grouped by first language, 40 groups in Academic and 40 in General Training. Reading those tables row by row shows where each group's scores collect: in Academic the share scoring 7.0 or above runs from 14.2% among Japanese first-language candidates to 88.0% among German first-language candidates, while at the 6.0 boundary all 40 groups have at least half their candidates above the line. It covers group distributions only: the workbook prints no candidate counts, so every share here describes a group, not a person.
Key findings
- Across the 40 Academic first-language groups, the share of candidates scoring 7.0 or above ranged from 14.2% among Japanese first-language candidates to 88.0% among German first-language candidates, with a median of 41.2% [1].
- Every one of the 40 Academic groups had at least half its candidates at 6.0 or above, from 50.9% (Japanese) to 98.3% (German), so the 6.0 boundary is the common ground and the 7.0 tail is where groups separate [1].
- In General Training, 6 of the 40 groups had fewer than half their candidates at 6.0 or above, from Dari at 21.9% to Vietnamese at 49.5%, and the median share at 7.0 or above was 34.9% against 41.2% in Academic [1].
- Of the 33 first-language groups that appear in both test types, the Academic share at 6.0 or above was higher in 25 and lower in 8 [1].
- Test type changes the tail for the same language: Chinese first-language candidates scored 7.0 or above in 15.5% of Academic cases against 37.7% in General Training, while Thai first-language candidates went the other way, 28.8% against 8.7% [1].
Background
IELTS reports an overall band plus four skill scores, and the demographic tables add a second dimension: how scores are distributed among candidates who share a first language. Readers often treat those groups as a difficulty label, so it is worth knowing what the published distributions actually contain. Each row is a share of that group's own candidates, not a share of all IELTS candidates, and the workbook prints 40 rows per test type in alphabetical order with no candidate counts [1]. This report reads the two frequency tables and reports only what they print, plus sums of adjacent published bands.
Data and method
Source and window. All figures come from the IELTS demographic data for 2024-2025, the two worksheets that publish band frequencies by first language, one for IELTS Academic and one for General Training [1].
Sample. The unit is a first-language group, and the workbook publishes 40 of them for each test type. Each row distributes that group's own candidates across 12 band columns, from below 4 to 9, and the published shares in each row sum to 100%. No head count is published for any row, and the rows are listed alphabetically rather than by size.
Definitions. This article's thresholds are sums of adjacent published columns: below 6.0 is the published bands below 4, 4, 4.5, 5 and 5.5; 6.0 to 6.5 is bands 6 and 6.5; 7.0 or above is bands 7, 7.5, 8, 8.5 and 9; and 6.0 or above is everything from band 6 upward. A group is below a threshold when its summed share is under 50%.
This article's own counts. Every range, median and count here was produced by summing the published columns for each row and then comparing rows. Medians are unweighted across the 40 published groups, because the workbook supplies no candidate counts with which to weight them. The distribution bins in Figure 3 are this article's own grouping of the 40 Academic rows.
Processing. Only published, aggregated tables are used; no individual candidate record is involved. Shares are quoted to one decimal place as calculated from the published columns.
Design. The data are observational, and the tables cover the overall band only, not the four skill scores.
Results
The Academic tail separates groups far more than the 6.0 boundary does. At 7.0 or above, the range across the 40 groups runs from 14.2% among Japanese first-language candidates to 88.0% among German first-language candidates, and the median is 41.2%. The top of the range is led by German (88.0%), Greek (74.4%), Italian (65.2%), English (63.6%) and Portuguese (60.2%); the bottom is led by Japanese (14.2%), Chinese (15.5%), Punjabi (20.3%), Bengali (20.7%) and Khmer (21.7%). At 6.0 or above, by contrast, the spread narrows sharply: the lowest group sits at 50.9% and the highest at 98.3%, so no Academic group has more candidates below 6.0 than above it.
The shape of that distribution is visible when the 40 Academic groups are binned by their 7.0-or-above share. Two groups sit at 70% or above, 3 between 60% and 69%, 4 between 50% and 59%, 12 between 40% and 49%, 6 between 30% and 39%, and 13 below 30%. Most groups therefore cluster in the middle, and the high tail is thin.
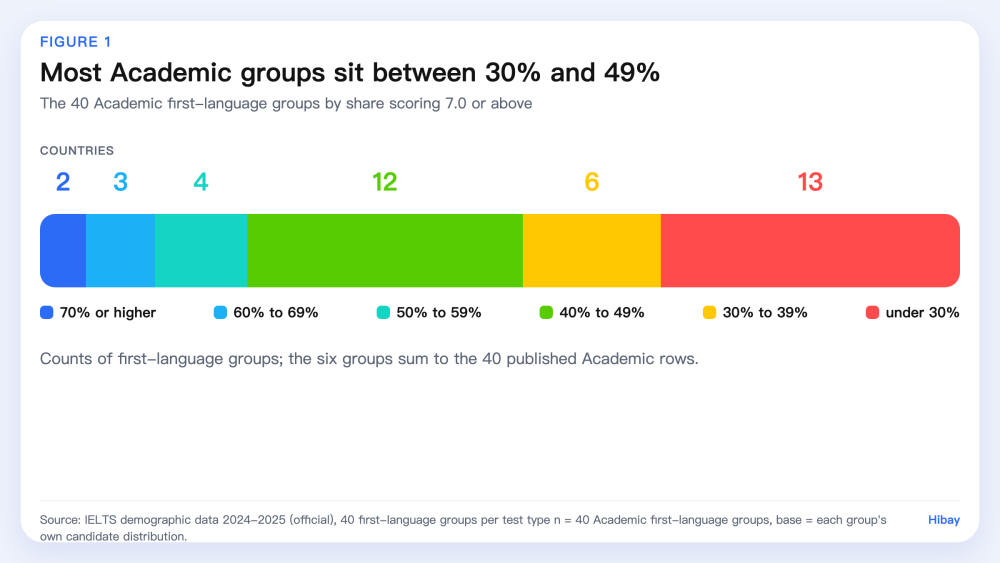
Figure 1. The 40 Academic first-language groups grouped by share of candidates scoring 7.0 or above, n = 40 groups, base = each group's own candidate distribution. Source: IELTS demographic data 2024-2025, Academic frequency by first language.
General Training sits lower on both measures. Its median share at 7.0 or above is 34.9% against 41.2% in Academic, and 6 of its 40 groups have fewer than half their candidates at 6.0 or above: Dari at 21.9%, Pashto at 34.1%, Thai at 34.2%, Indonesian at 48.3%, Japanese at 49.5% and Vietnamese at 49.5%. No General Training group reaches the 70% bin, and 15 groups sit below 30% at 7.0 or above.
Test type also reorders groups that appear in both tables. Of the 33 shared first-language groups, the Academic share at 6.0 or above is higher in 25 and lower in 8. The five examples below show the tail rather than the threshold:
| First-language group | Academic, 7.0 or above | General Training, 7.0 or above |
|---|---|---|
| German | 88.0% | 67.6% |
| Chinese | 15.5% | 37.7% |
| Thai | 28.8% | 8.7% |
| Arabic | 25.7% | 26.4% |
| Japanese | 14.2% | 15.9% |
Each cell is this article's own sum of the published bands 7 to 9 for that row; the two columns are separate candidate populations, so the table compares distributions and not the same people.
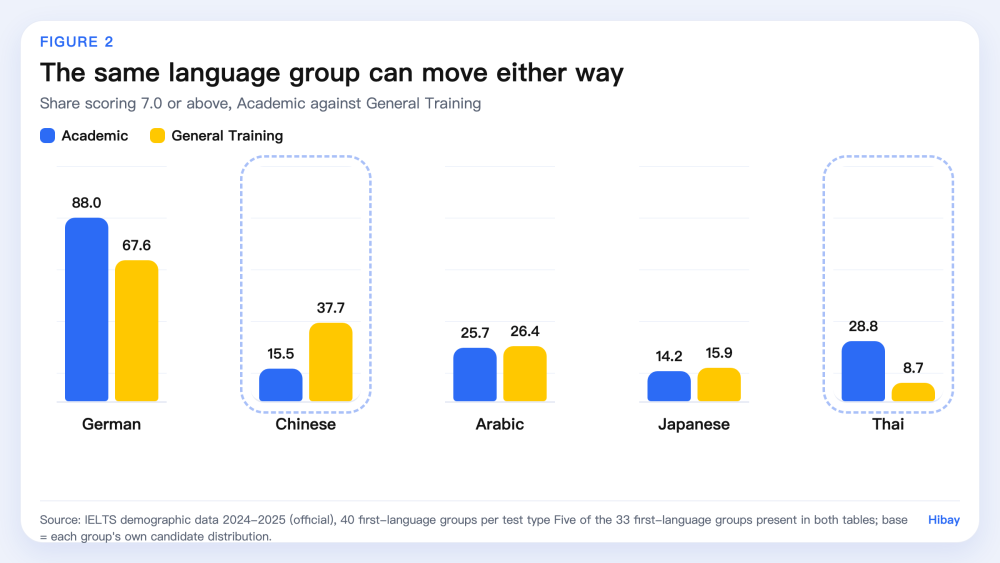
Figure 2. Share scoring 7.0 or above in Academic and in General Training for five first-language groups present in both tables, base = each group's own candidate distribution. Source: IELTS demographic data 2024-2025, frequency tables by first language.
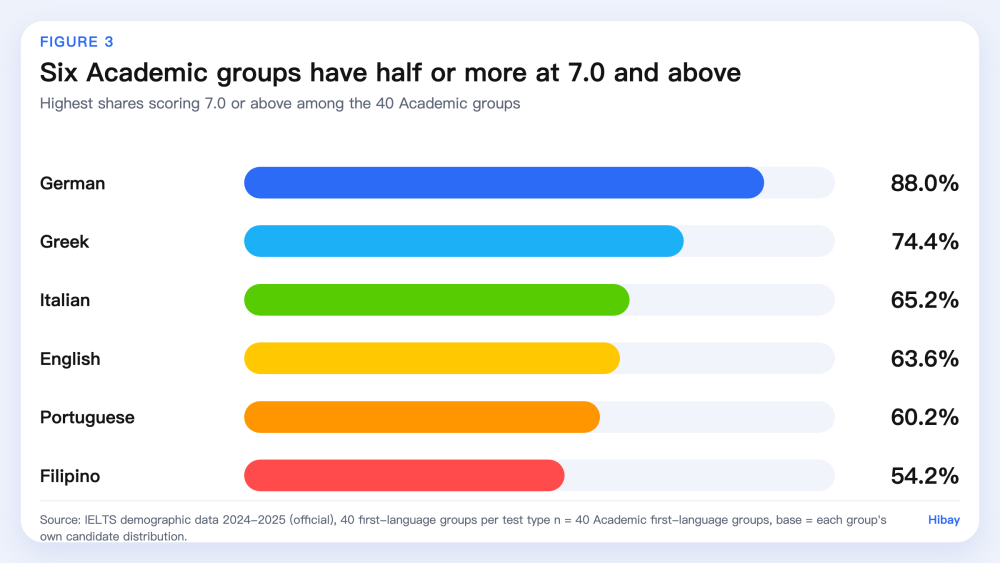
Figure 3. The six highest Academic shares at 7.0 or above among the 40 published first-language groups, base = each group's own candidate distribution. Source: IELTS demographic data 2024-2025, Academic frequency by first language.
Limitations
Four limits apply to everything above. First, the workbook publishes no candidate counts, so group sizes are unknown: a 14.2% share from a large group and an 88.0% share from a small one are printed with the same weight, and the medians in this article are unweighted across groups for that reason. Second, the tables name only the first-language groups with enough candidates to publish, 40 per test type, listed alphabetically, so groups outside that list are absent and the 33 shared names are the only ones that can be compared across test types. Third, the distribution covers the overall band only, so a group's low 7.0-or-above share says nothing about which skill held it back, and published IELTS skill means show that gap varies by group. Fourth, the shares describe test takers, and group membership is not a property of any individual: nothing here supports a claim that a candidate's first language sets a ceiling, and no figure in this article is evidence about what produced a difference.
What this means for learners
The 6.0 boundary is common ground in these tables, and the 7.0 tail is where groups differ most, so a target band is worth reading as a position rather than as a label attached to a language. Because the same first-language group can look different in Academic and in General Training, the test type a candidate sits is part of the picture, and the four skill scores are not visible at all in this dataset. A learner aiming for 7.0 or above is aiming at the thinner part of the distribution, which is where regular speaking practice with immediate feedback can help; practice feedback is a study aid, not an official band, and Hibay does not issue IELTS scores.
Frequently Asked Questions
What share of IELTS candidates score 7.0 or above? There is no single figure across groups. In the 40 Academic first-language groups the share scoring 7.0 or above ranged from 14.2% to 88.0%, with a median of 41.2%; the equivalent General Training median was 34.9% (see Results).
Do candidates from some first-language groups score much lower than others? Among the published groups, yes at the top of the scale: 13 of the 40 Academic groups have fewer than 30% of candidates at 7.0 or above, while 2 groups are at 70% or above. At the 6.0 boundary the differences are small, since every Academic group has at least 50.9% of candidates there.
Can the same candidate group be compared across Academic and General Training? The tables are separate populations, so the comparison is between distributions for two sets of candidates who share a first language. For Chinese first-language candidates the Academic share at 7.0 or above is 15.5% and the General Training share 37.7%.
Does first language determine an IELTS score? No. The tables report group distributions of one overall band, and they carry no candidate counts. They show association between a group label and where scores cluster, not what any candidate can achieve.
How to cite
Hibay Product Team. (2026, October 30). IELTS Band Shares by First Language: 2024-2025 Official Tables. Hibay. https://www.hibay.ai/en/news/ielts-band-share-by-first-language-2024-2025
Figures are from the public sources listed below and may be cited with attribution.
References
- IELTS. IELTS demographic data 2024-2025 (band frequencies by first language, Academic and General Training). https://ielts.org/cdn/ielts-downloadable-assets/ielts-research/ielts-research-data/ielts-demographic-data-2024-2025.xlsx. Accessed 2026-10-30.