
Band 9 Is 17 Times More Common on IELTS General Training
Band 9 is rare on both IELTS tests, but 0.54% of General Training candidates reach it against 0.03% of Academic candidates.

On this page
IELTS publishes a band distribution for every nationality group it reports, separately for Academic and General Training, and the top of those distributions is not the same on the two tests. Across the 40 nationalities in the 2024-2025 tables, 0.54% of General Training candidates reached Band 9, against 0.03% of Academic candidates, a ratio of about 17 to one. The tables report shares of candidates, not candidate records, and IELTS lists nationalities alphabetically rather than by candidature size, so the figures describe published groups only.
Key findings
- Across the 40 nationalities listed, 0.54% of General Training candidates and 0.03% of Academic candidates reached Band 9 in 2024-2025.
- The ratio holds at the top of the scale too: 5.0% of General Training candidates scored 8.5 or above, against 1.9% of Academic candidates.
- Band 9 appears in the distribution of 38 of the 40 General Training nationality groups, but in only 35 of the 40 Academic groups.
- The highest Academic share is 0.31% in Germany; the highest General Training share is 14.0% among candidates reporting the United States as their nationality.
- Five Academic nationality groups record no candidate at Band 9 at all, while two General Training groups do the same.
Background
IELTS reports results on a nine-band scale, with half-band steps below 9, and the score is reported per skill and as an overall band [1]. The two versions of the test — Academic and General Training — share Listening and Speaking but use different Reading and Writing papers, and the official statistics are published as separate tables for each version [2].
Most public discussion of IELTS scores works from country means. The demographic tables go further: for each nationality and first language, they publish the full share of candidates at each band from the lowest published band up to 9, which makes the shape of a national cohort visible rather than only its average [1]. This report uses those shares and nothing else.
Data and method
The source is the IELTS demographic data workbook for 2024-2025, sheets "AC frequency by nationality" and "GT frequency by nationality" [1]. Each row is one nationality and each column one band, with the cell holding the share of that group's candidates whose overall band fell in that column. The sample is the 40 nationalities that IELTS lists for both test versions; each row is a published aggregate of that group's candidates, and no individual record is published.
Two calculations are used here. The first is the share of candidates at Band 9 for a nationality, read directly from the published cell. The second is a simple unweighted mean of those 40 shares, which describes the set of listed nationalities rather than all IELTS candidates, because IELTS does not publish the number of candidates behind each row. The same method is applied to the combined 8.5-and-9 column. The data are aggregated at nationality level, no cell is inferred, and all figures are quoted as published shares rounded to two decimal places. The sample is the set of published group rows in the source table, the key metric in each case is a published group mean or a share or difference computed from published means, and all values are aggregated at group level with no individual record used.
Results
The gap at Band 9 is large enough that it is visible without any modelling. Averaged across the 40 listed nationalities, the General Training share is 0.54% and the Academic share is 0.03%; the medians tell the same story at 0.11% and 0.01%. A candidate is far more likely to reach the top band on General Training than on Academic in this published data, and the distance between the two averages is about 17 times.
The gap is not confined to the single top band. Adding the 8.5 column lifts the General Training average to 5.0% and the Academic average to 1.9%, so the advantage at the very top of the scale is also present one half-band lower, where the shares are large enough to be read as a rate rather than as a rounding artifact.
The national extremes are wide. Germany has the highest Academic share at 0.31%, and its combined 8.5-and-9 share is 14.2%. On the General Training side the highest share, 14.0%, belongs to candidates who report the United States as their nationality, and their combined 8.5-and-9 share reaches 61.0%. Only two General Training groups and five Academic groups record no candidate at Band 9.
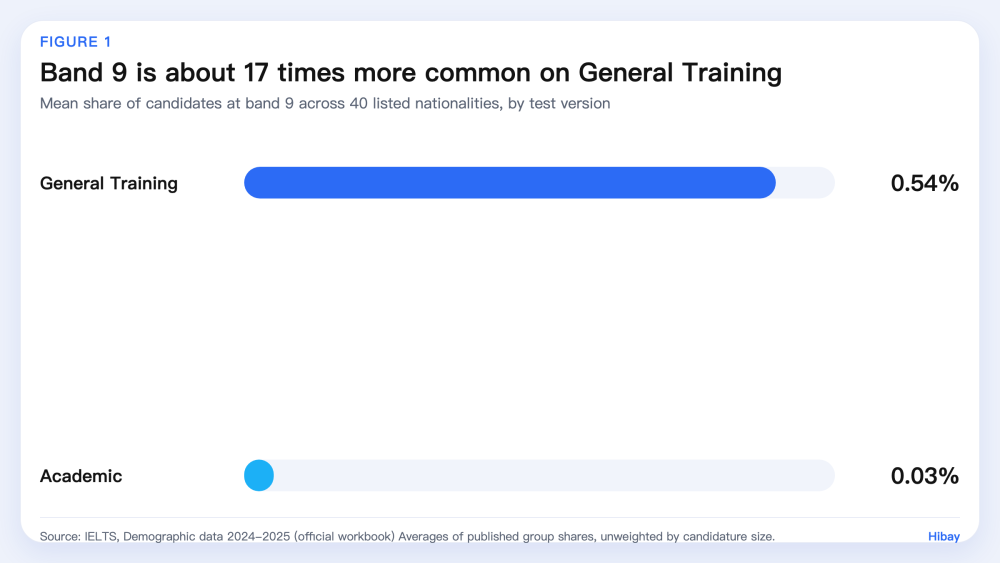
Figure 1. Share of candidates at Band 9 and at 8.5 or above, averaged across the 40 listed nationalities for each test version, n = 40 nationality groups per version. Source: IELTS demographic data 2024-2025.
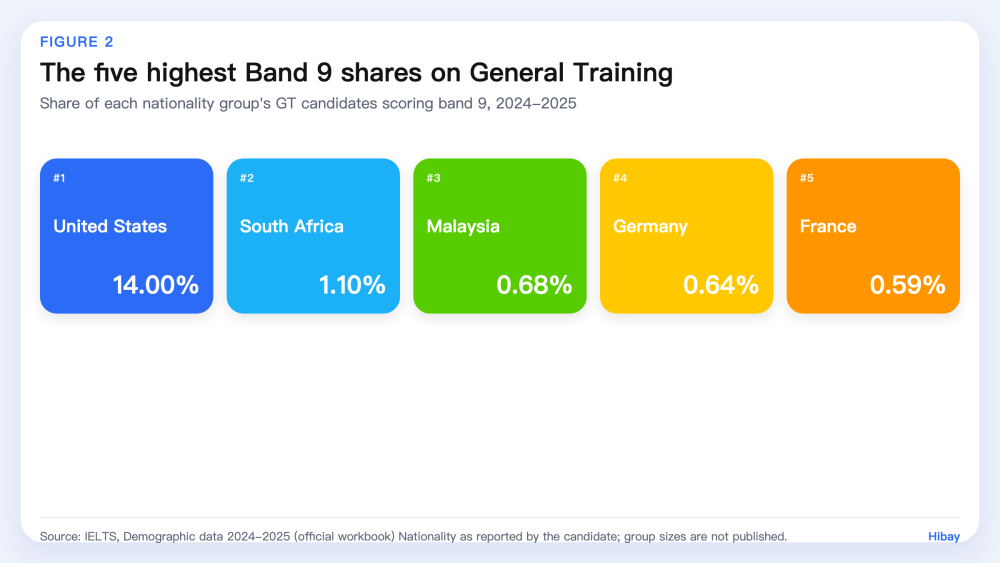
Figure 2. The five highest Band 9 shares among the listed General Training nationality groups, n = 40 nationality groups. Source: IELTS demographic data 2024-2025.
Limitations
Three limits matter. First, IELTS publishes shares rather than counts, so a high share can rest on a small group: the United States General Training row is the clearest case, because candidates who report that nationality are a small and unusual subset of the table and many are likely to be first-language English speakers. Second, the tables list the top nationalities alphabetically rather than by candidature size, so a simple average across 40 rows gives each listed nationality the same weight and does not represent the global candidate pool. Third, the distribution is of overall band only; the tables do not say which skill produced a Band 9, and nothing here separates candidates by test purpose, preparation or number of attempts. The comparison is therefore between published groups, not between two tests that a single learner could choose between under equal conditions.
What this means for learners
Band 9 is an outlier on both tests, and the practical reading is about expectations rather than about which paper is easier. A learner who needs a top band should treat 9 as a rare outcome that depends on the whole profile, not as a target to be reached by switching test version. The more useful comparison is at 7.0 and 7.5, where shares are large enough that a realistic plan can be built around them.
The General Training figure also carries a warning about reading national tables. A group's share describes the candidates in that group, with their own mix of first languages, purposes and preparation, and it says nothing about what an individual can expect. Country-level IELTS statistics are published for research and teaching, and they are not a forecast.
Frequently Asked Questions
Is General Training easier than Academic because more candidates reach Band 9?
No conclusion about difficulty follows from these tables. General Training and Academic use different Reading and Writing papers and are taken by different populations, and the published shares mix both effects. The tables also do not report how many candidates sat each version.
What share of IELTS candidates reach Band 9?
In the 2024-2025 tables, the Band 9 share averages 0.54% across the 40 listed General Training nationality groups and 0.03% across the 40 Academic groups. Those are unweighted averages of published group shares, not a global rate.
Why does the United States appear in the General Training table?
IELTS records nationality as reported by the candidate, so the row covers candidates who gave the United States as their nationality. It is a small group, and its 14.0% Band 9 share should be read as a description of that group rather than as a national average.
How to cite
Hibay Product Team. (2026, November 5). Band 9 Is 17 Times More Common on IELTS General Training. Hibay. https://www.hibay.ai/en/news/ielts-band-9-general-training-rate
References
- IELTS. Demographic data 2024-2025 (XLSX workbook, sheets "AC frequency by nationality" and "GT frequency by nationality"). https://ielts.org/cdn/ielts-downloadable-assets/ielts-research/ielts-research-data/ielts-demographic-data-2024-2025.xlsx. Accessed 2026-11-05.
- IELTS. Test statistics. https://ielts.org/researchers/our-research/test-statistics. Accessed 2026-11-05.