
Two IELTS Rankings, One Country: Agreement at 0.69
Ranking the same nationalities on IELTS Academic and on General Training produces two orders that agree at 0.69, less than any pair of skills agrees within one test.

On this page
IELTS publishes separate nationality tables for Academic and General Training, and the two tables rank the same countries rather differently. Over the 30 nationalities that appear in both, the rank correlation between Academic and General Training overall means is 0.69, below the 0.80 to 0.86 that the skills reach within the Academic table alone. The tables list nationalities alphabetically rather than by size, report group means rather than candidate records, and not every nationality appears on both tests.
Key findings
- Across the 30 nationalities listed in both tables, Academic and General Training overall means rank together at 0.69.
- That is lower than any of the four Academic skill pairs, which run from 0.80 to 0.86, so the test version separates countries more than the skill does.
- Academic overall means span 2.16 bands, from Oman's 5.41 to Germany's 7.57; General Training means span 3.25 bands, from Saudi Arabia's 4.94 to the United States group's 8.19.
- Germany is near the top of both tables, first on Academic at 7.57 and second on General Training at 7.23, but Saudi Arabia moves from 5.85 on Academic to 4.94 on General Training, a fall of 0.91 bands.
- The General Training table includes a United States group that does not appear in the Academic table at all, and that group holds the highest General Training mean.
Background
Academic and General Training share the Listening and Speaking papers and differ in Reading and Writing, and IELTS reports a separate set of statistics for each version [1]. Each version's nationality table gives a mean per skill and an overall mean for the groups that IELTS lists [2].
A country's two rows are often quoted as if they measured one national level. They are produced by different papers, taken by different groups of candidates with different purposes, and published in separate tables, so the comparison is between two populations rather than between two measurements of the same people. The rank correlation measures how much the two tables agree anyway.
Data and method
The source is the IELTS test taker performance workbook for 2024-2025, sheets "AC mean by nationality" and "GT mean by nationality" [2]. Each sheet lists nationality groups, with a mean Listening, Reading, Writing, Speaking and overall band for each group.
The two sheets are matched on nationality name, which gives 30 groups present in both; the analysis is restricted to those 30 so that each country contributes one point to each ranking. Spearman's rank correlation is computed on the overall band column and reported to two decimals; ranges are the highest published mean minus the lowest within each sheet, over all 40 groups listed in that sheet. The nationalities are a fixed alphabetical list, not a sample, and the data are aggregated at nationality level with no individual record used. The sample is the set of published group rows in the source table, the key metric in each case is a published group mean or a share or difference computed from published means, and all values are aggregated at group level with no individual record used.
Results
The two tables disagree more than the four skills do. Within the Academic table, the closest pair of skills ranks countries at 0.86 and the loosest at 0.80; across test versions, the same countries rank at 0.69. A country's position on Academic is therefore a weaker guide to its position on General Training than its Reading position is to its Writing position.
The spread of the two tables also differs. Academic overall means run from Oman's 5.41 to Germany's 7.57, a range of 2.16 bands, while General Training means run from Saudi Arabia's 4.94 to the United States group's 8.19, a range of 3.25 bands. The General Training column is the wider one, which is consistent with the smaller and more varied set of candidates who take that version for work, migration and training rather than for university admission.
Some countries move a long way. Saudi Arabia averages 5.85 on Academic and 4.94 on General Training, a difference of 0.91 bands, and moves from the middle of one table to the bottom of the other. Germany stays near the top of both, 7.57 on Academic and 7.23 on General Training. The United States group appears only in the General Training table, where it holds the highest mean, 8.19, and has no Academic row to compare with, which is one reason the matched set is 30 rather than 40.
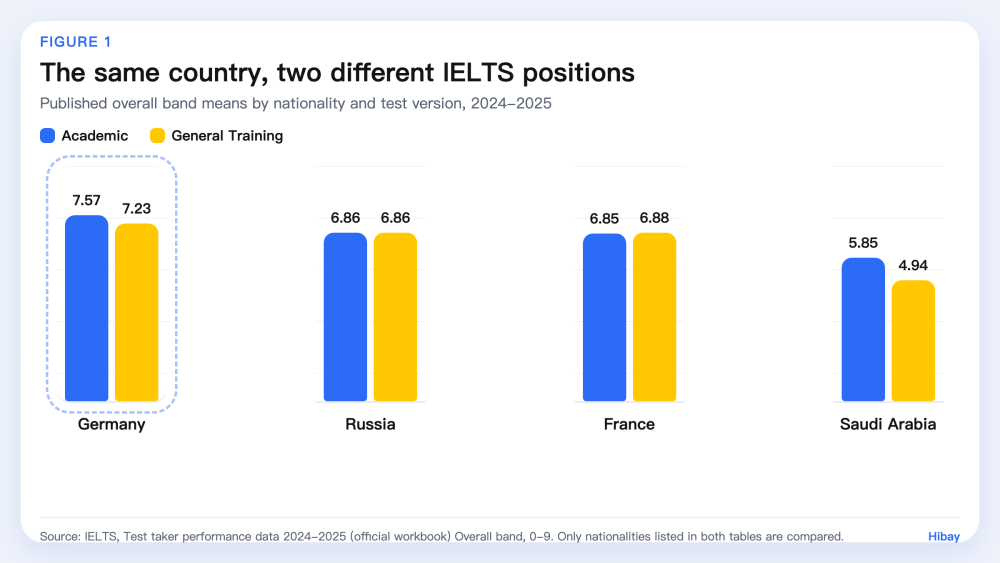
Figure 1. Published overall band means by nationality and test version for four groups present in both tables, n = 30 matched nationality groups. Source: IELTS test taker performance data 2024-2025.
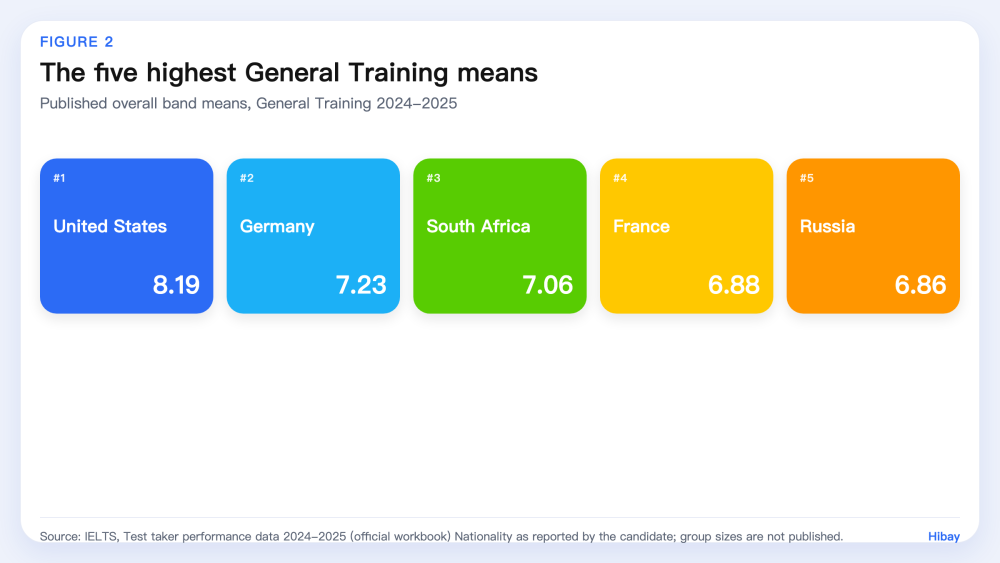
Figure 2. The five highest published General Training overall means, n = 40 nationality groups in the General Training table. Source: IELTS test taker performance data 2024-2025.
Limitations
Four limits apply to this comparison. First, the two tables describe different candidate populations: Academic is taken largely for study and General Training largely for work, migration and training, and the same nationality can be represented by very different people on each version. Second, only 30 nationalities appear in both tables, and the unmatched ten are not missing at random, so the correlation describes a subset of the published groups. Third, the tables do not report candidate numbers, so a group can be small and still carry the same weight in a rank correlation as a large one; the United States General Training row is the clearest example of a group whose size is unknown here. Fourth, a rank correlation says nothing about why two rankings differ, and differences in candidates, preparation and paper design are all mixed together.
What this means for learners
The practical reading is that "the national average" is not one number. A learner preparing for university admission and a learner preparing for a work or migration requirement are looking at two published tables that order countries differently, and a figure quoted from one does not transfer to the other.
For a learner choosing which comparison to trust, the matched-country data suggests using the table for the version they are actually taking. Germany's two rows are close, but Saudi Arabia's are almost a band apart, and that difference is the reason a cross-version comparison is a weak guide.
Frequently Asked Questions
Why do the two IELTS versions rank countries differently?
The tables cover different candidate populations taking different Reading and Writing papers. IELTS does not publish the number of candidates behind each row or the reasons they chose a version, so the sources of the difference cannot be separated from these tables.
Is a 0.69 rank correlation high?
It is a moderate positive relationship: countries near the top of one table tend to be nearer the top of the other, but with many exceptions. For comparison, the closest pair of skills inside the Academic table reaches 0.86.
Can I compare my country's two rows directly?
The rows describe different groups of candidates, not the same people measured twice. The published means are a description of each group and not a conversion between the two tests.
How to cite
Hibay Product Team. (2026, November 5). Two IELTS Rankings, One Country: Agreement at 0.69. Hibay. https://www.hibay.ai/en/news/ielts-academic-general-training-rank-agreement
References
- IELTS. Test statistics. https://ielts.org/researchers/our-research/test-statistics. Accessed 2026-11-05.
- IELTS. Test taker performance data 2024-2025 (XLSX workbook, sheets "AC mean by nationality" and "GT mean by nationality"). https://ielts.org/cdn/ielts-downloadable-assets/ielts-research/ielts-research-data/ielts-test-taker-performance-data-2024-2025.xlsx. Accessed 2026-11-05.