
Capital Cities Run 16 Points Above Their Countries: EF EPI 2025
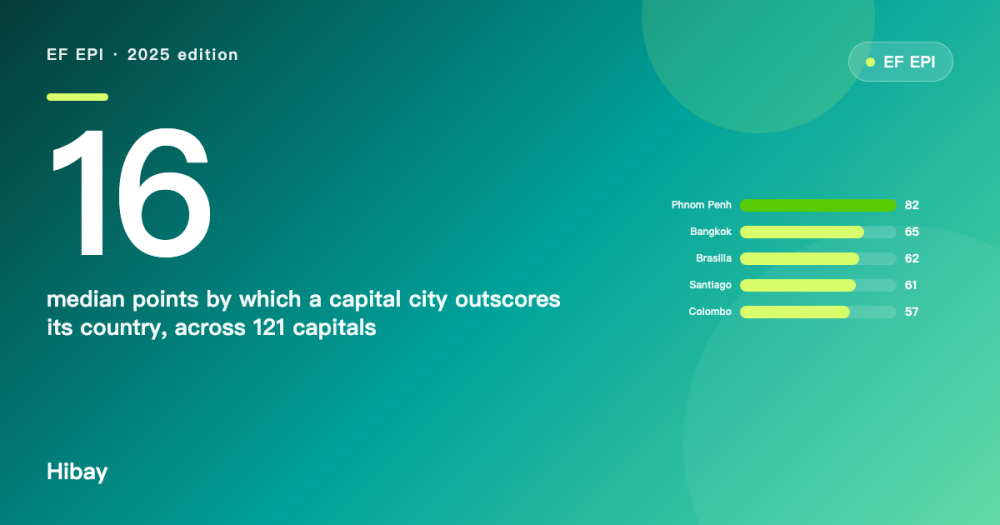
The EF EPI 2025 ranks 123 countries and prints a separate table of capital city scores. In 104 of 121 matched cases the capital scores higher, at a median of 16 points, and the exceptions are as instructive as the rule.

On this page
A national English score is usually read as a description of a country. The EF English Proficiency Index 2025 publishes both a national ranking and a separate table of capital city scores, and putting the two columns side by side shows that the capital is usually the better-scoring place. Across the 121 capitals that could be matched to a ranked country, 104 score above their national figure and 15 below, at a median gap of 16 points. This report compares the two published columns; both are aggregates of a self-selected online test sample, so the gap is a difference between aggregated published scores and does not describe any individual test taker.
Key findings
- Of the 121 capitals that carry both figures, 104 score above their country's national score, 15 score below and 2 are level, at a median gap of 16 points.
- The widest gaps are in countries with low national scores rather than in the strongest ones: Phnom Penh scores 472 against Cambodia at 390, a gap of 82, and Bangkok 467 against Thailand at 402, a gap of 65.
- Only 15 capitals trail their country, and the largest shortfall is New Delhi at 407 against India at 484, a gap of 77 the other way.
- The gap narrows in the strongest band: the median is 10 points across the 31 countries scoring 560 or above, against 17 points across the 32 countries scoring 500 to 559.
Background
The EF EPI is built from the EF SET, a free online adaptive test of reading, listening, speaking and writing. Each edition ranks countries and regions, and the 2025 edition also prints a table of capital city scores, which is a separate published list rather than a recomputation of the national figures [1]. The index requires at least 400 test takers for a country to be ranked and at least 100 for a city to appear, and national scores are three-year rolling averages [2].
A capital city is not a random sample of its country. Capital regions concentrate universities, ministries, international employers and the diplomatic populations that go with them, and they hold the largest share of jobs that require English. A city-level score is therefore a partial measure of the English environment a learner actually meets, as distinct from the average of a whole territory. The comparison is also a check on how a national score should be read: if capitals systematically outscore their countries, a national figure understates conditions in the capital and overstates them elsewhere, and the size of that difference is the useful quantity.
Data and method
Source and window. The figures come from the EF EPI 2025 report: the country and region ranking on pages 6 to 7 and the capital city scores on pages 10 to 11 [1], with the index methodology from EF's own methodology page [2]. Scores are based on EF SET tests taken during 2024 and published as the 2025 edition.
Sample. The 2025 edition ranks 123 countries and regions, built from more than 2,200,000 EF SET tests. A country needs at least 400 test takers to enter the index and a city at least 100 [2]. Of the 123 ranked entries, 121 have both a national score and a capital city score in the published tables and are used here; each capital is a single city, so its figure rests on that city's own sample.
Definitions. A gap is the capital city score as printed minus the national score as printed, both in EF EPI points on a scale where 600 marks the very high band. A gap is positive when the capital scores higher. Group comparisons use the median rather than the mean, because single cities, especially with small samples, produce outliers; each group's count is the number of ranked countries in that score band.
Processing. All figures are read from the two published tables and differenced; no score has been recalculated, smoothed or rounded, and every value is an aggregated figure over the published country and city samples with no individual record involved. Every gap printed in this report is registered in the accompanying data file with the two source values. The correlation between a national score and its capital gap is a Pearson coefficient across the 121 matched pairs.
Results
The typical country shows a capital that scores higher: the median gap is 16 points and the mean 17.3, a distribution close to symmetric around a clear positive value. The leaders are not the top-ranked countries. Phnom Penh scores 472 against Cambodia at 390, a gap of 82; Bangkok scores 467 against Thailand at 402, a gap of 65; Brasilia scores 544 against Brazil at 482, a gap of 62; Santiago scores 578 against Chile at 517, a gap of 61; and Colombo scores 543 against Sri Lanka at 486, a gap of 57. Jakarta, Quito, Algiers and Beijing each sit at a gap of 50 or more.
The strong countries are a different picture. Copenhagen scores 644 against Denmark at 611, a gap of 33, but the Netherlands shows Amsterdam at 630 against a national 624, a gap of 6, and South Africa shows Cape Town at 603 against 602, a gap of 1. Kenya shows Nairobi at 595 against a national 593, a gap of 2, Portugal's capital and country both print 612, and Berlin's 625 against 615 is a gap of 10.
The fifteen capitals that trail their countries are the more surprising group. New Delhi at 407 against India at 484 is the extreme: a shortfall of 77. India is one of the largest test-taking populations in the index, so the shortfall is not a thin-sample artefact. Jerusalem scores 498 against Israel at 524, a gap of 26 the other way, and Brussels scores 588 against Belgium at 608, a gap of 20. Kuwait City at 441 against 455, Mexico City at 428 against 440, Warsaw at 591 against 600, Tehran at 485 against 492 and Mogadishu at 391 against 398 complete the list of shortfalls printed in the two tables.
Grouping the 121 pairs by national score makes the pattern clearer than the individual cases. Among the 31 countries scoring 560 or above, the median gap is 10 points. Among the 32 scoring 500 to 559 it is 17 points, and among the 58 scoring below 500 it is 16.5 points. The Pearson correlation between the national score and the size of the gap is -0.16, which is close enough to zero to reject the idea that the capital advantage simply scales with proficiency.
Two readings follow. Capitals outperform in most countries, so a national score is a lower bound on conditions in the capital region and an upper bound on conditions outside it. And the advantage is not a rich-country phenomenon: it is largest where the national English environment is thinnest, which is what a concentration story predicts, since the gap between an internationally connected capital and the rest of the territory should be widest where access is thinnest.
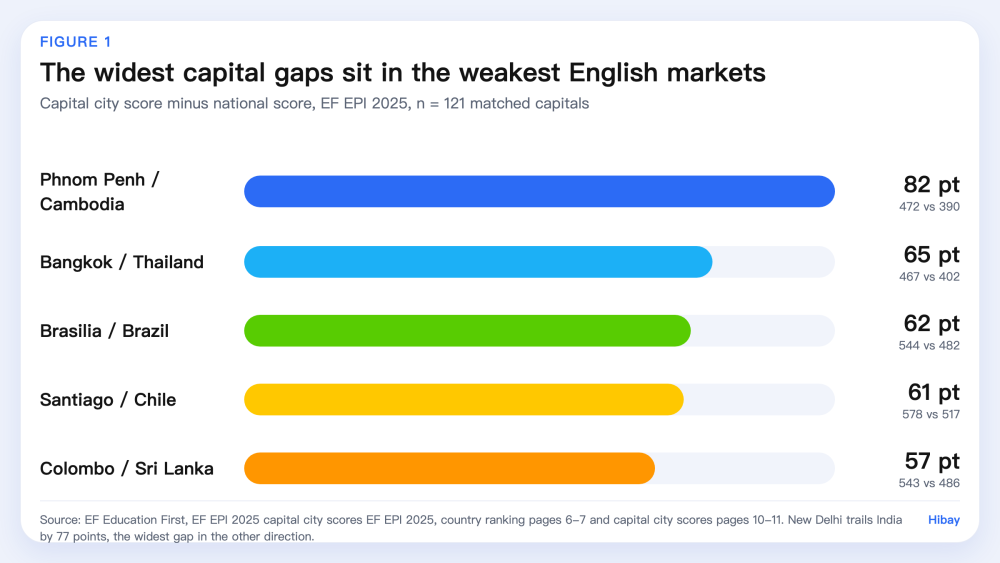
Figure 1. The five widest capital-city gaps in the EF EPI 2025, in points, with the two published scores behind each. n = 121 matched capitals. Source: EF EPI 2025, capital city scores pages 10-11.
Limitations
Four limits apply. First, the city and country samples are different groups of self-selected test takers, and EF publishes no overlap or weighting between them, so the gap is a difference between two aggregates and cannot be attributed to the same people. Second, each capital figure rests on that city's own sample with a floor of 100 test takers, a low threshold that lets a small-sample capital move several points between editions for reasons unrelated to the city. Third, both columns are three-year rolling averages, which smooths real change as well as noise, and the report prints no city-level confidence intervals. Fourth, the 123-entry ranking contains no entry for the United Kingdom, the United States, Canada, Australia, Ireland or New Zealand, so the countries compared are a particular subset of the world rather than a sample of it.
What this means for learners
A national score describes a distribution a learner may not be standing in. Outside a capital region the national figure is likely to overstate the English actually met day to day, and inside the capital it is likely to understate it. Either way it is a benchmark for a population.
The direction of the gap is the actionable finding. The capital advantage is largest where national English is thinnest, which means the local environment is doing less of the work in exactly the places where a learner needs the most deliberate practice. That argues for practice with feedback on a specific skill rather than immersion by proximity. Practice feedback is not an official score, and Hibay does not issue one.
Frequently Asked Questions
Do capital cities always have the best English in their country? No. Of the 121 capitals with both figures, 15 score below their national average, and the largest shortfall is New Delhi at 407 against India at 484. The capital table compares a capital with a national average, not with the country's highest-scoring city.
How big is a typical capital-city gap? The median is 16 points and the mean 17.3 points across the 121 matched pairs. The distribution is wide: Phnom Penh runs 82 points above Cambodia, while New Delhi runs 77 points below India.
Why would a capital score lower than its country? The two figures are averages of different samples, so a capital with a large share of lower-scoring test takers can trail a country whose test takers are concentrated in high-scoring regions. EF does not publish the underlying city samples, so the reason cannot be established from the report.
How to cite
Hibay Product Team. (2026, November 4). Capital Cities Run 16 Points Above Their Countries: EF EPI 2025. Hibay. https://www.hibay.ai/en/news/ef-epi-2025-capital-cities
Figures are from the public sources listed below and may be cited with attribution.
References
- EF Education First. EF English Proficiency Index 2025: A Ranking of 123 Countries and Regions by English Skills. Country ranking, pages 6-7, and capital city scores, pages 10-11. https://www.ef.com/assetscdn/WIBIwq6RdJvcD9bc8RMd/cefcom-epi-site/reports/2025/ef-epi-2025-english.pdf. Accessed 2026-11-04.
- EF Education First. About EF EPI: methodology, sample and minimum test-taker thresholds. https://www.ef.com/wwen/epi/about-epi/. Accessed 2026-11-04.