
IELTS Writing Task 1: When the Task Gives You Two Charts
An IELTS Writing Task 1 sample answer for a two-chart task: build one overview that covers both visuals, split the body paragraphs by theme instead of by chart, and finish inside twenty minutes.

On this page
Almost every IELTS Writing Task 1 practice set shows a single graph, so the first time a paper puts two visuals side by side — a line graph plus a pie chart, or a bar chart above a table — the twenty-minute budget disappears before the second visual is finished. The problem is rarely vocabulary. It is a decision made in the first minute: whether to treat the page as one task or as two. This guide works through a complete IELTS Writing Task 1 sample answer for a combined task, shows how one overview can cover both visuals, and sets out a minute-by-minute budget you can rehearse before test day.
What a combined task is actually asking for
Start with the official shape of the task. In IELTS Academic Writing, Task 1 asks you to describe visual information — a graph, table, chart or diagram — in your own words, in at least 150 words, in about 20 minutes. Task 2 asks for at least 250 words in about 40 minutes, and it contributes twice as much as Task 1 to the Writing score on the public ielts.org description of the test. The same description notes that in Task 1, all the information you require is given in the visual itself.
That point defines the task type. IELTS describes Academic Task 1 as an information-transfer task, one that relates narrowly to the factual content of a graph, table, chart, map or other visual input and not to speculative explanations that lie outside the given data. You are not being asked why bus travel fell. You are being asked to show, accurately and selectively, what the numbers do.
Two visuals change only one part of that job: selection. You still write one answer with one overview, but you have to choose which features matter across both images. The instruction printed with Academic Task 1 stays the same — summarise the information by selecting and reporting the main features, and make comparisons where relevant — and with two visuals, "where relevant" becomes the centre of the task rather than a formality.
The failure mode is easy to describe because it is so common. Paragraph one narrates chart A; paragraph two narrates chart B; the two paragraphs could be swapped without anyone noticing, because nothing links them. The public band descriptors name this pattern at Band 5, where key features selected are not adequately covered and the recounting of detail is mainly mechanical. Mechanical recounting is exactly what happens when you describe each visual in isolation.
Writing one overview for two visuals
An overview is the one or two sentences that name the biggest pattern your answer will explain. It is not a list of figures, and it is not a restatement of the task. Markers look for it explicitly: in the public Writing Task 1 band descriptors, Band 7 Task Achievement reads that the response presents a clear overview, that the data are appropriately categorised, and that main trends or differences are identified, while Band 6 asks only that a relevant overview is attempted. The step from Band 6 to Band 7 is not a longer answer. It is a more decisive summary.
With one visual, the overview is usually the overall direction. With two, it is the relationship between them, and there are three reliable patterns.
Three overview patterns you can reuse
- Shared direction. Both visuals move the same way, so the overview says so once:
Both charts point the same way, although the pie chart shows that the growth was concentrated in a single category. - Contrast. The two visuals pull against each other:
The line graph shows a steady rise in total journeys, but the pie chart shows that this rise came almost entirely from one mode of transport. - Composition split. One visual covers change over time, the other covers the mix at a moment in time:
The line graph tracks how the total changed over fifteen years, while the pie chart shows how that total was divided at the end of the period.
Each pattern does the same work. It names the two visuals inside one sentence and makes a claim that covers both. Notice what none of them do: they do not explain why the change happened, because the data cannot answer that, and they do not list more than one figure. An overview that quotes six numbers is a body paragraph wearing a summary's clothes.
A practical test: read your overview sentence on its own. If it could sit above a completely different pair of charts without becoming false, it is too general to earn credit. If it collapses the moment you remove the second visual, it is doing its job.
Body paragraph split: by chart or by theme
Once the overview is fixed, the body paragraphs carry the detail. There are two ways to divide them, and only one of them behaves well under time pressure.
Splitting by chart means one body paragraph per visual. It is the layout most candidates default to, because it mirrors the page in front of them. Its weakness is structural: a paragraph that only describes chart A has nothing to compare, and comparison is what the Task Achievement criterion rewards, since it asks candidates to compare or contrast the information by highlighting identifiable trends, principal changes or differences rather than to describe mechanically.
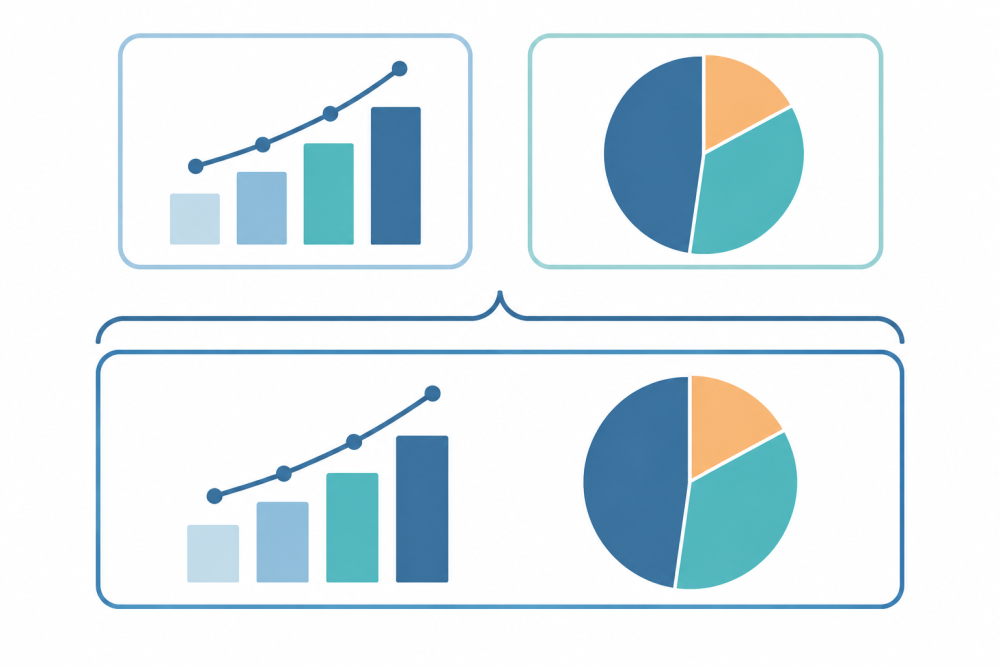
Splitting by theme means one body paragraph per comparison. Each paragraph draws on whichever visual supports that comparison, so a single paragraph can begin inside the line graph and end inside the pie chart.
| Question | Split by chart | Split by theme |
|---|---|---|
| Where the two visuals meet | Only in the overview sentence | In every topic sentence |
| Comparison sentences | Rare, and usually bolted on at the end | Built into the first line of each paragraph |
| Repetition risk | High: two blocks of the same sentence pattern | Lower: each paragraph has a different job |
| Planning time | Feels faster | Feels slower |
| Writing time | Slower, because the paragraph has no argument | Faster, because the topic sentence dictates the figures |
| Descriptor risk | Mechanical recounting | Categorised data and identified trends |
Why theme order holds up better under time pressure
Theme order is stronger for a practical reason: it forces the comparison sentence to exist before you write the detail. Here is a topic sentence that sets up the first body paragraph of the worked example below:
The line graph shows steady growth in public transport journeys, but the pie chart shows that this growth was not shared evenly between the two modes.
That sentence is already doing three things. It names both visuals, it states the relationship, and it commits you to figures that support it. If you write it first, the paragraph can only be coherent. If you write it last, you will usually discover that the numbers you collected belong to different comparisons, and by then there is no time left to restructure the paragraph.
A full annotated answer to a line graph plus pie chart task
The task below is an original practice task written for this article, with invented figures. The numbers are not taken from any real test paper; they are chosen so that the two visuals interact in a predictable way. If you want the wider menu of visual types, the full guide to describing graphs, charts, maps and processes covers each one separately.
Practice task. The line graph shows the number of journeys made by bus and by metro in one city between 2005 and 2020. The pie chart shows the share of all journeys made by each mode of transport in 2020. Summarise the information by selecting and reporting the main features, and make comparisons where relevant.
| Year | Bus journeys (millions) | Metro journeys (millions) |
|---|---|---|
| 2005 | 400 | 100 |
| 2010 | 410 | 205 |
| 2015 | 395 | 380 |
| 2020 | 380 | 570 |
The pie chart for 2020 divides one thousand million journeys into three parts: bus 38%, metro 57%, and other modes 5%.
Model answer (about 200 words).
The line graph compares the number of bus and metro journeys made in one city over a fifteen-year period, while the pie chart breaks down all journeys by mode of transport in the final year. Overall, demand for public transport grew strongly, but the growth came almost entirely from the metro: bus journeys declined, and by 2020 the metro carried more than half of all trips.
In 2005, the bus was clearly the dominant mode, with 400 million journeys against 100 million by metro. Bus use stayed close to that level for the next decade, peaking at 410 million in 2010 before falling to 380 million in 2020. Metro journeys, by contrast, rose in every period shown, from 100 million in 2005 to 205 million in 2010 and then to 380 million in 2015, at which point the two modes were level.
The pie chart shows the result of this shift. By 2020 the metro accounted for 57% of all journeys, compared with 38% for buses, and the remaining 5% were made by other modes. A network that had been built around bus travel in 2005 therefore ended the period with the metro as its main carrier, even though the number of bus journeys fell only moderately.
Annotations.
- Sentence one names both visuals, their subject and their units, so the reader knows what the page contains before the overview arrives.
- "Overall" marks the overview, and the sentence makes one comparative claim that covers both visuals. No figure appears in it.
- The second paragraph handles the line graph but groups the two lines at each checkpoint, instead of describing one line to 2015 and then starting the other line back in 2005.
- The third paragraph handles the pie chart and connects it to the trend with "the result of this shift", so the switch between visuals does not read like the start of a new essay.
- Every figure quoted appears in the table or the pie chart, and no sentence invents a cause for the change.
Time budget and the two minutes people forget
Twenty minutes sounds generous until you try to spend it. The budget below is the one the worked answer was written under, and the first two minutes are the part most candidates skip.
A minute-by-minute budget
- Minutes 0–2: read the task and write the overview sentence. Decide the relationship before you decide the figures.
- Minutes 2–5: mark four to six figures that support the overview, and group them into two sets, one for each body paragraph.
- Minutes 5–15: write the introduction, the overview and the two body paragraphs. Aim for 170 to 200 words.
- Minutes 15–18: check every figure against the visual, and check that each body paragraph opens with a comparison.
- Minutes 18–20: correct what you found. Do not start again.
The forgotten two minutes are the first ones. Candidates who begin at minute two by typing "The line graph shows" have already decided, without noticing, that they will describe the visuals in the order they appear on the page. That single decision is what produces two disconnected descriptions. Two minutes spent choosing the relationship is what prevents it.
Checking the answer against the public criteria
A final read-through is only useful if you know what is being counted. The four criteria are Task Achievement, Coherence and Cohesion, Lexical Resource, and Grammatical Range and Accuracy, and each one is assessed independently. If you are unsure how those descriptors are applied in marking, the guide to the writing band descriptors explains the four columns.
| Criterion | What the public Band 7 descriptor asks for | The question to ask your own draft |
|---|---|---|
| Task Achievement | A clear overview, appropriately categorised data, identified main trends or differences | Does one sentence in my answer cover both visuals? |
| Coherence and Cohesion | Information logically organised, with a clear progression throughout | Could a reader state my comparison after reading only the first line of each paragraph? |
| Lexical Resource | Enough resource for some flexibility and precision, with an awareness of style and collocation | Do my trend verbs vary without becoming inaccurate? |
| Grammatical Range and Accuracy | A variety of complex structures used with some flexibility and accuracy | Are my while and whereas sentences correct, or merely long? |
One scoring fact is worth keeping in mind while you time yourself: Task 2 contributes twice as much as Task 1 to the Writing score. Overspending on Task 1 therefore costs more than it earns, which is a further argument for spending the first two minutes on a decision rather than on a sentence.
Frequently asked questions
One overview or two when the task has two charts?
One. The overview is a single statement about what the visual information shows as a whole, and the descriptors ask for a clear overview rather than one impression per image. Two overview sentences usually mean you have written two descriptions and put a summary in front of each. If the two visuals genuinely share nothing measurable, say so in one sentence and move on; that sentence is still the overview.
Should body paragraphs follow the charts or the themes?
Themes, unless the two visuals are unrelated. A paragraph organised around a comparison gives you a natural place to put figures from both visuals, which is what the descriptor means by appropriately categorised data. Splitting by chart is defensible when the visuals share no measurable relationship, or when one visual needs a short paragraph of its own, as with a process diagram or a map. Even then, keep one sentence in each paragraph that refers back to the overview, so the answer still reads as a single response.
What should I do in the last two minutes?
Check three things, in this order. First, words and figures: every number you quoted must exist in the visual, and the answer must reach at least 150 words. Second, structure: each body paragraph should open with a comparison rather than a label, and there should be no bullet points anywhere in the answer. Third, the overview: read it on its own and ask whether it would still be true if the figures were different. If it would, it is too general to be useful.
Where to practise next
Reproducing the answer above on paper, with a timer, is the quickest way to find out whether the overview arrives early enough. Rehearse it until the first two minutes feel automatic, and vary the data so that you cannot memorise the figures. HiBay's preparation material includes IELTS speaking practice with AI conversation partners, if you also want to work on the spoken half of the test in the same place.