
IELTS Writing Task 1: How to Describe Graphs, Charts, Maps and Processes
Describing visual information in IELTS Writing Task 1 is a skill you can rehearse. This guide sets out what the official format page and the published examiner comments require, gives model sentences for graphs, tables, maps and processes, and shows how to check your own answer against a published IELTS Writing Task 1 sample answer.


On this page
IELTS Academic Writing Task 1 hands you the data and asks you to put it into words: one or more graphs or charts, a table, a map, or a diagram of a process. The official IELTS Academic Writing test format page states that you describe some visual information in your own words, that you must write at least 150 words, and that you should spend about 20 minutes on it, while Task 2 contributes twice as much as Task 1 to your Writing score. This guide covers the four visual types, the paragraphs each one needs, the sentences that carry a clear description, and how to check your work against the examiner comments published with the official IELTS Writing Task 1 sample answer scripts.
What the Task Really Asks You to Do
The same official page sets rules that decide much of your score before style matters. You must write at least 150 words, in one piece of connected text, because notes and bullet points are penalised. The answer must relate to the topic and be your own writing, because copied text is severely penalised. Aim for an academic or semi-formal, neutral style.
The examiner guidance published in the official IELTS Academic Writing sample tasks calls Task 1 Academic an information-transfer task: it relates narrowly to the factual content of the graph, table, chart, map or diagram, not to speculative explanations that lie outside the data. That rules out the common habit of explaining why the numbers changed.
Read the Prompt Before You Look at the Data
In the first two minutes, answer four questions: what is compared, what the units are, what period or process is involved, and how many groups, lines or stages you can see. Every later paragraph depends on them.
The prompt sentence is worth reading twice, because it is also something you must not copy. The published examiner comments on several official sample scripts note that rubric text reused word for word shows an inability to paraphrase, and no credit is given for it. Your opening sentence should say the same thing in your own words. If the rubric says the chart shows the number of men and women in further education in Britain in three periods, an opening such as The chart compares the number of male and female students in further education in Britain across three periods. does the same job with a different structure.
Graphs and Charts: Describe the Direction of Change
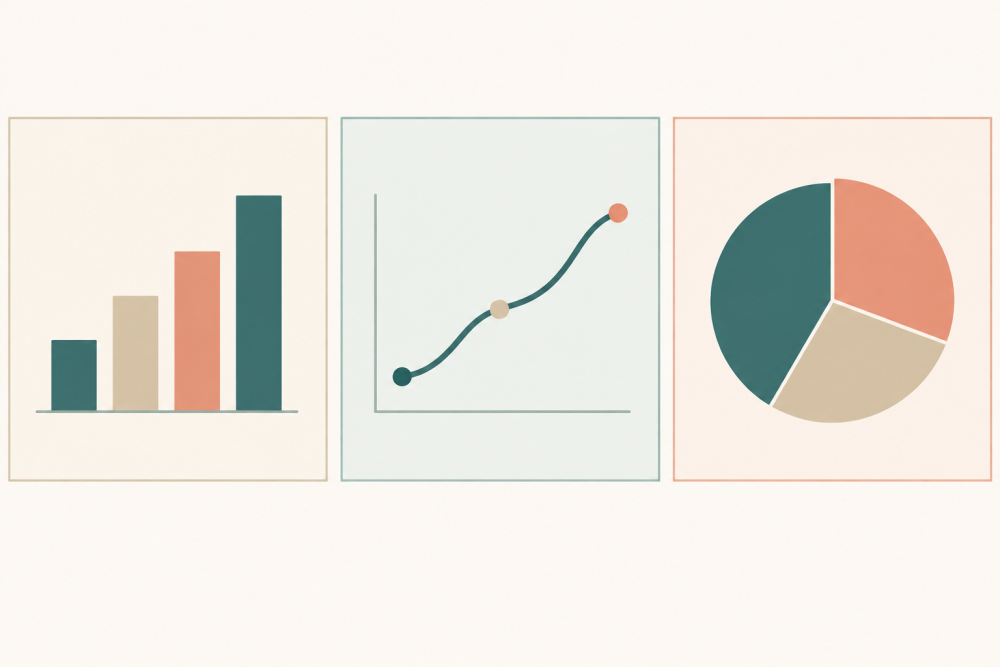
A line graph or bar chart usually shows a trend, and the trend is what your overview reports: put the overall shape first, then support it with the figures that matter most.
Overall, part-time student numbers rose steadily across the three periods, while full-time numbers stayed almost flat.
After the overview, group the data: the largest change, the smallest change, and one comparison a reader would not guess. You do not have to list every value on the axis; reporting the main features and making relevant comparisons is what the task asks.
For a chart that tracks two audiences or two products across a day, the interesting sentence is the contrast:
Radio audiences peaked in the early morning, whereas television audiences reached their highest point in the evening.
Tables and Pie Charts: Compare Shares, Not Just Numbers
A table asks you to find the pattern in the grid first: which row is largest, which is smallest, which pair is closest. A pie chart shows shares of one whole, so the language of proportion matters more than raw totals.
The chart compares the proportion of households with internet access in three countries between 2000 and 2020.
Avoid arithmetic the visual does not support: if two values are close, say they are similar rather than inventing a ranking.
Maps: Two Views and One Direction of Change
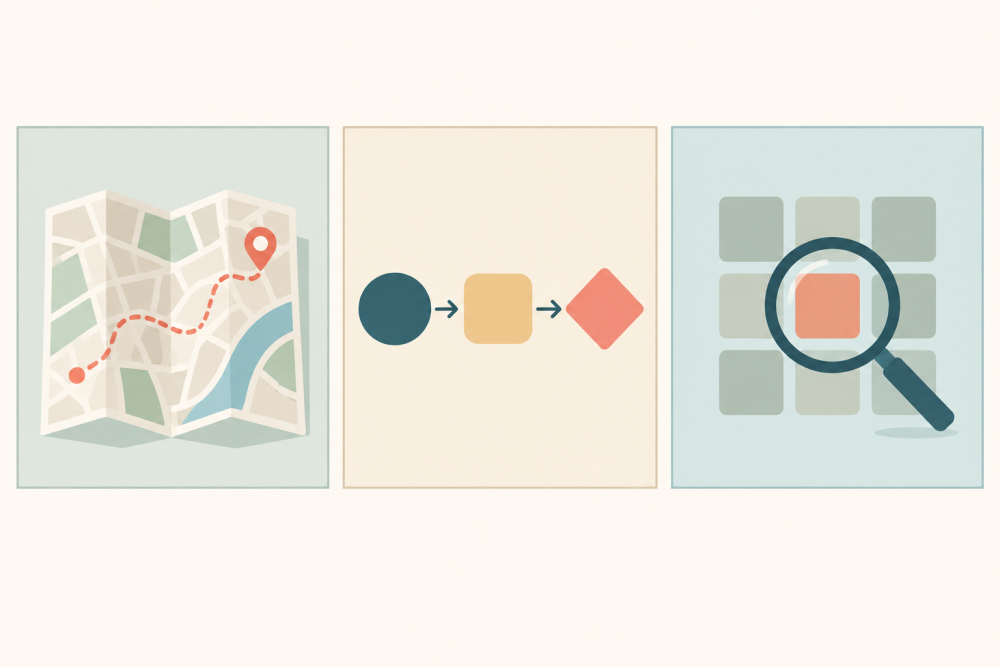
Maps in Academic Task 1 usually appear as two views of the same place at two moments. Describe what changed, where the change happened, and what stayed the same. Direction words carry more of the score here than adjectives: north, south-east, opposite, alongside, adjacent to, in the north-west corner.
The most noticeable change is that the farmland in the north was replaced by housing, while the river and the main road stayed in the same position.
Use the past tense for changes shown as finished and the present tense for features present in both views. If a future date divides the two maps, name that date rather than switching tenses by accident.
Processes and Diagrams: Stages in Order
A process diagram, like the official sample task that shows how bricks are manufactured for the building industry, is a sequence rather than a set of numbers. Your overview names the number of stages and the start and end points, and your body paragraphs walk through the stages in order.
The process begins with the extraction of clay and ends with the delivery of finished bricks.
Sequencing words are the backbone: first, next, after that, once, before, finally. The passive voice is usually right, because the diagram rarely says who performs each step. Verbs do the work here, so collect a few precise ones before you write: extracted, shaped, dried, fired, transported, packaged.
Write the Overview Before the Details
Every published examiner comment on Task 1 returns to the same point: an answer without an overview loses marks. In one comment the examiner says a stronger answer would summarise the most important features, giving the example that radio audiences peak in the morning and television audiences peak in the evening. That is the model for your overview: one or two sentences, no figures, the shape of the whole.
Put the overview directly after your opening sentence, before any detail paragraph; it is the cheapest band improvement in Task 1 and takes about three minutes.
Check Your Own Answer Against the Public Criteria
Your answer is marked on four criteria: task achievement, coherence and cohesion, lexical resource, and grammatical range and accuracy. The official sample tasks document explains each one and prints candidate scripts with examiner comments at bands from 5 to 8.5. Reading two comments side by side is more useful than reading ten model answers, because they name the features that move a script up: a clear overview, accurate figures, paragraphs that follow the data, and vocabulary and grammar under control.
A Twenty-Minute Routine You Can Repeat
Split the twenty minutes into four blocks and keep the split the same every time. Three minutes to read the prompt and plan the grouping. Two minutes to write the opening sentence and the overview. Ten minutes to write two body paragraphs and check every figure against the visual. Four minutes to re-read for articles, plurals, tense and word count, and to remove anything you cannot explain.
Practise with a timer, because the constraint is time as much as language. If you want an estimate of your band before the next attempt, the HiBay app listing describes IELTS preparation tools that include reviewing your writing essays, and this free IELTS writing checker guide explains what such a check can and cannot prove. When you move on to the longer essay, IELTS Writing Task 2 essay structure covers the spine that Task 2 needs.
Frequently Asked Questions
How do I describe a graph, chart, map or process in IELTS Writing Task 1?
Start by deciding which of the four visual types you are looking at, because each one has a different job: a graph or chart wants a trend and selected figures, a table wants the pattern inside the grid, a map wants changes in place and position, and a process diagram wants stages in order. Write a one-sentence opening that paraphrases the prompt, then an overview that names the most important features without numbers, then one or two body paragraphs that group the detail instead of listing it. Keep the register academic or semi-formal, keep the whole answer above 150 words, and use the past tense for changes that are already finished and the passive voice for stages where the person doing the work is not named. Finish by re-reading for articles, plurals and figures, because those small errors are the ones examiners can see immediately.