
IELTS 2024-2025: Where the Middle Academic Candidate Sits
Official IELTS band distributions for 40 nationalities: the median band is 6.5 in 19 of them and 5.5 in only three, a two-band range across the table.

Pada halaman ini
Most IELTS reporting quotes a mean, but a mean hides the shape of the score distribution. This report reads the official 2024-2025 band distributions for Academic candidates instead, and asks a simpler question: in each nationality group, which band does the middle candidate reach? The answer moves across the table but not much. In 19 of the 40 nationalities listed, half of the candidates score 6.5 or below; only three groups have a median of 5.5, and only one reaches 7.5. The figures come from published distributions, not candidate records, and IELTS lists the top nationalities alphabetically rather than by candidature size.
Key findings
- The median band is 6.5 in 19 of the 40 nationalities in the official 2024-2025 Academic distribution table, and 6.0 in 11 more.
- The median ranges from 5.5 in Kuwait, Oman and the United Arab Emirates to 7.5 in Germany, a two-band span across the whole table.
- Only six nationalities have a median of 7.0 or higher, and one of the three lowest-median groups, Oman, still sends 7.4% of candidates to 7.0 or above.
- The tails differ more than the middle: 45.2% of Omani Academic candidates score below 5.5 against 0.5% of German candidates, while the two groups' medians sit just two bands apart.
- At the same median of 6.0, China places 13.8% of candidates at 7.0 or above and Japan 14.5%, while Korea, at a median of 6.5, places 28.5%.
Background
An IELTS overall band runs from 1 to 9 in half-band steps, and the four skills are scored separately before the overall band is derived [2]. Because a half band is a large step at the individual level, two countries can share a mean and still look very different once the distribution is opened up: the same average can come from a tight cluster around one band or from wide tails at both ends. Universities and immigration routes usually set a minimum overall band and sometimes a minimum per skill, which means the share of candidates crossing a threshold matters more to an applicant than the average does. This report therefore reports medians and tail shares rather than means.
Data and method
The source is the IELTS demographic data for 2024-2025, sheet "AC frequency by nationality", which gives the share of Academic candidates in each nationality group falling in each band: below 4, then 4, 4.5, 5, 5.5, 6, 6.5, 7, 7.5, 8, 8.5 and 9 [1]. Forty nationalities are listed. Each row sums to one, and the sheet publishes no candidate counts, so no group can be weighted by size.
The median band for a group is the band at which the cumulative share first reaches half of that group's candidates, read from the lowest band upward. A group whose candidates are split evenly across 6.0 and 6.5 therefore reports 6.0, not a midpoint between them; the measure is deliberately coarse because the published table is coarse. The share at 7.0 or above is the sum of the 7, 7.5, 8, 8.5 and 9 columns, and the share below 5.5 is the sum of the below-4, 4, 4.5 and 5 columns. Both are shares of that nationality's candidates, not of all IELTS candidates.
All data are aggregated shares published by IELTS; no individual record is used. Shares are rounded to one decimal place, medians are exact half-band values, and counts of nationalities are whole numbers. The 40 rows are the nationalities IELTS chose to publish and are listed alphabetically, so they are not a random or exhaustive sample.
Results
The middle of the table is crowded. Nineteen of the 40 nationalities have a median band of 6.5 and 11 have 6.0, so three quarters of the groups sit within half a band of each other. Only three groups land at 5.5 (Kuwait, Oman and the United Arab Emirates), six reach 7.0 (France, Italy, Malaysia, the Philippines, Russia and Spain) and Germany alone reaches 7.5.
Figure 1. Number of nationalities by median Academic band, n = 40 nationality groups. Source: IELTS demographic data 2024-2025 [1].
The tails tell a different story. Oman's median is 5.5, yet 45.2% of its candidates score below 5.5 and 7.4% reach 7.0 or above, so the group is not uniformly weak; it is spread wide. The United Arab Emirates shows the same shape, with 43.0% below 5.5 and 15.9% at 7.0 or above, and Kuwait 39.8% and 15.9%. Germany sits at the other extreme, with 0.5% of candidates below 5.5 and 86.8% at 7.0 or above.
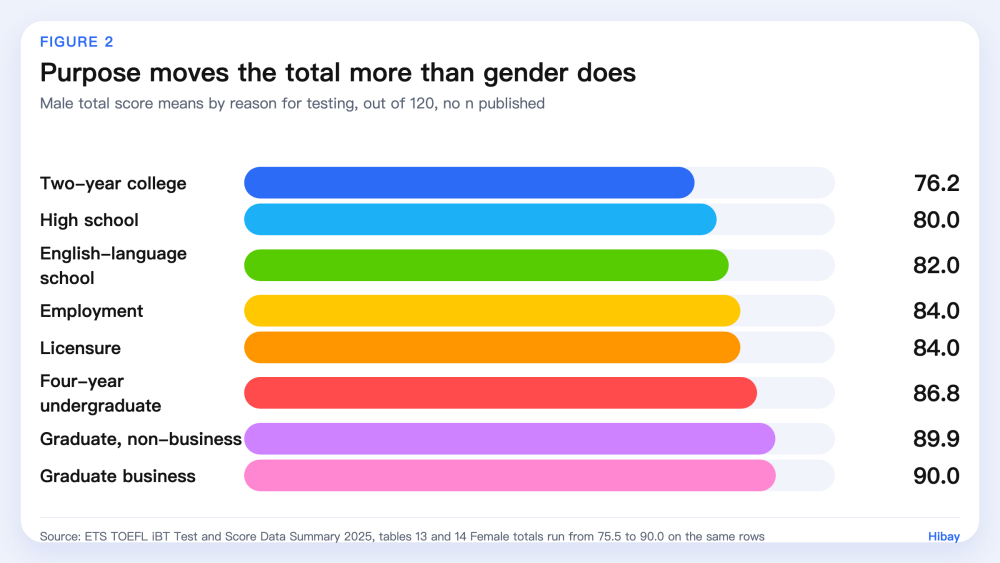
Figure 2. Share of Academic candidates below band 5.5, six nationalities from the 40 published, n = 40 nationality groups. Source: IELTS demographic data 2024-2025 [1].
| Nationality | Median band | Share below 5.5 | Share at 7.0 or above |
|---|---|---|---|
| Oman | 5.5 | 45.2% | 7.4% |
| Kuwait | 5.5 | 39.8% | 15.9% |
| Japan | 6.0 | 24.6% | 14.5% |
| China | 6.0 | 18.9% | 13.8% |
| Korea | 6.5 | 10.2% | 28.5% |
| India | 6.5 | 5.1% | 41.1% |
| Malaysia | 7.0 | 2.7% | 65.1% |
| Germany | 7.5 | 0.5% | 86.8% |
Read the table by row: the median is where the group's distribution crosses half, and the two share columns describe the tails on each side of it. A group can have a low median and a healthy top tail at the same time, as Oman and Kuwait do.
The comparison that matters most for applicants is between groups that look similar on the headline number. China and Japan share a median of 6.0 and 13.8% and 14.5% of their candidates at 7.0 or above, but Japan puts 24.6% of candidates below 5.5 against China's 18.9%. Korea's median is half a band higher and its top tail is roughly twice as thick as China's, at 28.5%. India combines a 6.5 median with 41.1% at 7.0 or above, and Malaysia a 7.0 median with 65.1%.
Limitations
Four limits apply. First, the table gives shares, not candidate counts, so a nationality with a few hundred candidates carries the same weight here as one with tens of thousands, and the medians cannot be combined into a global figure. Second, the median is a positional summary: it says where a group's middle sits, not how strong its candidates are individually, and a group with a wide spread can share a median with a much more compact one. Third, these are Academic candidates only, and they are not representative of English learners in the country, since people who sit IELTS are a self-selected group with study, work or migration plans. Fourth, the 2024-2025 edition is a single snapshot of published shares, the sheet lists the top nationalities alphabetically rather than by size, and nothing here links a band distribution to admission decisions or to how much a candidate studied.
What this means for learners
Set your target from the distribution, not from the average. If your destination asks for 7.0 overall, the useful question is what share of candidates in your position reach it, and in most of the 40 groups that share is well below half; in China and Japan it is under one in five. If you are between bands, the half band that separates a 6.5 median from a 7.0 median is a realistic goal for a focused preparation block, and speaking is the skill most often left out of self-study because it needs a partner or a tool. Hibay offers speaking practice with feedback between sessions, though that feedback is not an official IELTS score and does not predict a band.
Frequently Asked Questions
What is the average IELTS band in China? The published distribution does not give a mid-band figure directly; China's overall mean is 5.91 in the official tables, and its median band is 6.0, with 18.9% of candidates below 5.5 and 13.8% at 7.0 or above (see Results).
Which countries have the highest median IELTS band? Germany is the only nationality in the table with a median of 7.5. Six others reach 7.0: France, Italy, Malaysia, the Philippines, Russia and Spain (see Key findings).
Does a low median mean few candidates reach band 7? Not necessarily. Oman's median is 5.5 but 7.4% of its candidates score 7.0 or above, and Kuwait's is 5.5 with 15.9% at 7.0 or above, so a low middle and a live top tail can coexist (see Results).
How to cite
Hibay Product Team. (2026, November 2). IELTS 2024-2025: Where the Middle Academic Candidate Sits. Hibay. https://www.hibay.ai/en/news/ielts-median-band-by-nationality-2024-2025
Figures are from the public sources listed below and may be cited with attribution.
References
- IELTS Partners (British Council, IDP IELTS, Cambridge University Press & Assessment). IELTS demographic data 2024-2025: Academic frequency by nationality. https://ielts.org/cdn/ielts-downloadable-assets/ielts-research/ielts-research-data/ielts-demographic-data-2024-2025.xlsx. Accessed 2026-11-02.
- IELTS Partners. IELTS scoring in detail. https://ielts.org/take-a-test/your-results/ielts-scoring-in-detail. Accessed 2026-11-02.