
IELTS 2024-2025: Male-Female Gap Under a Tenth of a Band
Official IELTS 2024-2025 tables: the overall band differs by 0.06 in Academic and 0.11 in General Training, while skill gaps inside each group reach 0.57.

Pada halaman ini
IELTS publishes average band scores by gender for each test type in its official 2024-2025 performance data, and the two tables are close enough that the difference between them is smaller than the difference between skills inside either one. In Academic the overall band averaged 6.25 for female candidates and 6.19 for male candidates, 0.06 of a band apart; in General Training the averages were 6.41 and 6.30, 0.11 apart. The tables carry no candidate counts and only two rows per test type, so they describe published group averages and not individual candidates.
Key findings
- The overall band averaged 6.25 for female candidates and 6.19 for male candidates in Academic, a difference of 0.06, and 6.41 against 6.30 in General Training, a difference of 0.11 [1].
- No Academic section differed by more than 0.11: the female-minus-male difference was 0.01 in Listening, 0.05 in Reading, 0.07 in Writing and 0.11 in Speaking [1].
- The widest single-skill differences were both in General Training, at 0.15 of a band in Writing (6.20 against 6.05) and 0.15 in Speaking (6.46 against 6.31) [1].
- Writing was the lowest section for both groups in Academic (5.96 and 5.89), while Reading was the lowest for both groups in General Training (6.08 and 6.02), so test type separated the skill profile more than gender did [1].
- The spread between skills inside one group is larger than the spread between groups: in General Training the female Listening mean of 6.65 sits 0.57 of a band above the female Reading mean of 6.08, and the male equivalents (6.58 and 6.02) sit 0.55 apart [1].
Background
Band scores are read by universities, employers and immigration authorities as separate evidence for each skill, and the four sections are reported separately for that reason [1]. Public discussion of group differences usually stops at the headline average, which is why the published gender tables are worth reading in full: they print four section means and an overall band for each of two groups in each test type, alongside the share of candidates each group represents. That structure makes it possible to compare the size of a difference between groups with the size of a difference between skills in the same table.
Data and method
Source and window. All figures come from the IELTS test taker performance data for 2024-2025, specifically the worksheets that publish mean scores by gender for Academic and for General Training, plus the combined gender split [1].
Sample. The unit is a gender group within a test type. The workbook publishes 2 gender rows for each test type, with means for Listening, Reading, Writing, Speaking and Overall, and a separate sheet giving the gender split of Academic and General Training candidates combined. It carries no head counts, no gender-by-nationality cross-tabulation and no distribution, so base sizes cannot be stated and none of the differences below can be tested for statistical reliability.
Definitions. A section mean is the average band score on that skill for the group, and the overall band is the average of the four skills as computed by IELTS. A difference in this article is the female mean minus the male mean, computed from the published three-decimal values and then rounded to two decimals; a within-group spread is the highest section mean in a row minus the lowest.
Processing. Only published, aggregated tables are used; no individual candidate record is involved. Means are quoted to two decimals, rounded from the published three decimals, so a recomputed difference can differ by 0.01 from the figure printed here.
Design. The data are observational and describe two published groups.
Results
The overall gap is small in both test types. In Academic, 6.25 against 6.19 puts the two averages 0.06 of a band apart; in General Training, 6.41 against 6.30 puts them 0.11 apart. Female candidates were 53.1% of Academic and General Training candidates combined against 46.9% male, so the two groups are of similar size in the published split, which makes the small difference in averages a statement about the middle of two distributions rather than about a minority group.
| Score | Academic difference | General Training difference |
|---|---|---|
| Overall band | 0.06 | 0.11 |
| Listening | 0.01 | 0.07 |
| Reading | 0.05 | 0.06 |
| Writing | 0.07 | 0.15 |
| Speaking | 0.11 | 0.15 |
Each cell is the female mean minus the male mean for that score, computed from the published three-decimal averages and rounded to two decimals.
Section by section, Academic differences stay inside a tenth of a band. Listening differs by 0.01, Reading by 0.05, Writing by 0.07 and Speaking by 0.11, and the widest of these is smaller than the difference between Reading and Writing in the same table. General Training is where the two groups separate a little more: Writing differs by 0.15 and Speaking by 0.15, and the smaller differences sit in Reading at 0.06 and Listening at 0.07.
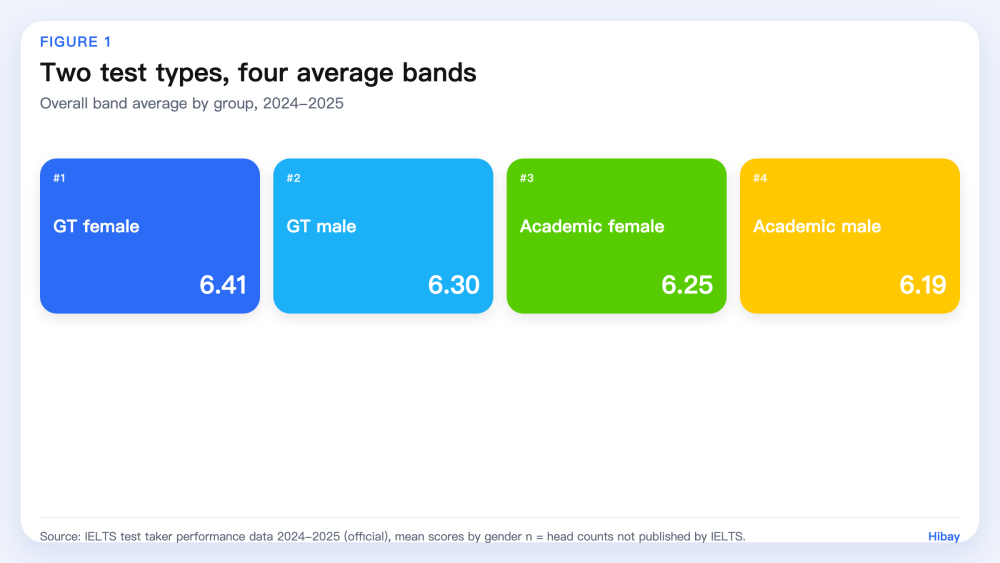
Figure 1. Overall band averages for the four published gender rows, n = head counts not published by IELTS. Source: IELTS test taker performance data 2024-2025, mean by gender worksheets.
The skills that sit at the bottom of each row are the same for both groups, and they change with the test type. In Academic, Writing is the lowest section for female candidates at 5.96 and for male candidates at 5.89. In General Training, Reading is the lowest for both groups, at 6.08 and 6.02, while Writing rises to 6.20 and 6.05. A candidate comparing the two test types is therefore looking at a different weak skill in each, which is a larger effect than the gender difference in the same rows.
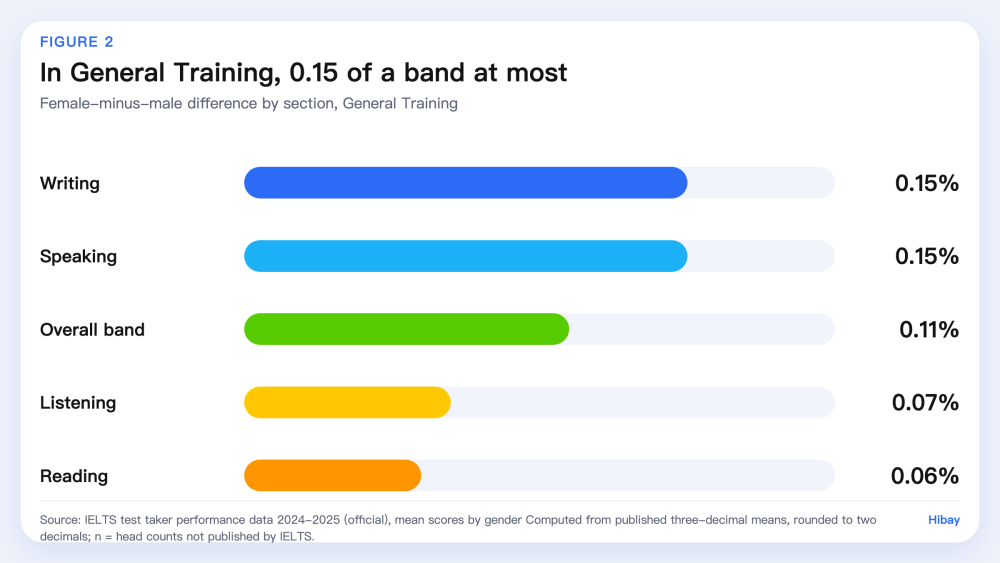
Figure 2. Female-minus-male difference in band score by section, General Training, computed from the published means, n = head counts not published by IELTS. Source: IELTS test taker performance data 2024-2025, General Training mean by gender.
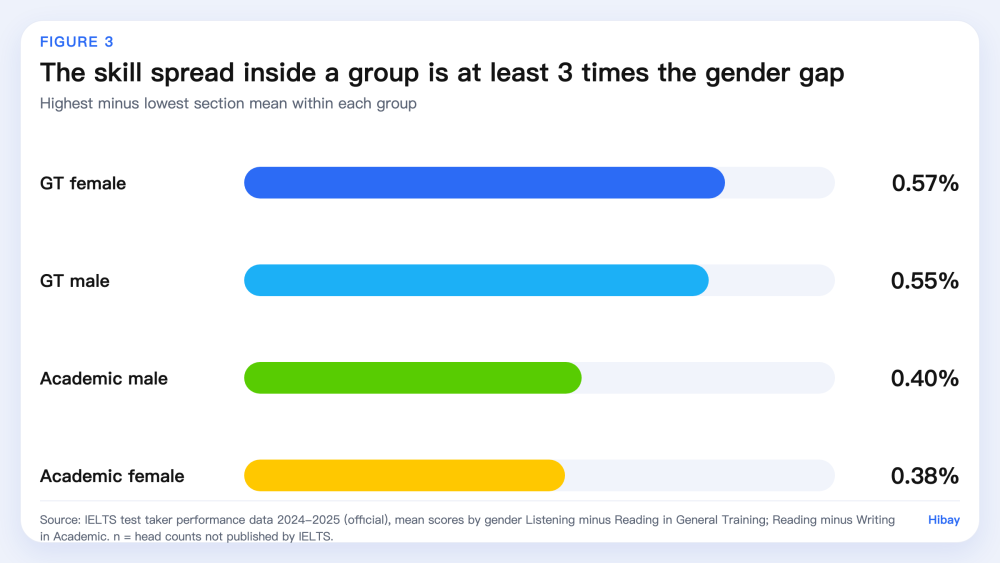
Figure 3. Spread from the highest to the lowest section mean inside each group: General Training female 0.57, General Training male 0.55, Academic male 0.40, Academic female 0.38, against between-group differences of 0.06 to 0.15, n = head counts not published by IELTS. Source: IELTS test taker performance data 2024-2025, mean by gender worksheets.
The within-group spread is the larger signal. In General Training, the female Listening mean of 6.65 is 0.57 of a band above the female Reading mean of 6.08, and for male candidates the same spread is 0.55, from 6.58 down to 6.02. In Academic the reading-to-writing spread is 0.38 for female candidates, from 6.34 to 5.96, and 0.40 for male candidates, from 6.29 to 5.89. Every one of those spreads is at least three times the largest between-group difference in the same test type.
Limitations
Four limits apply. First, the workbook publishes 2 gender rows per test type and no head counts, so there is no sample size behind any average and differences of a few hundredths of a band cannot be distinguished from rounding or from variation between candidates. Second, each cell is a mean: it says nothing about the shape of the distribution behind it, and two groups with identical means can differ widely in how many candidates reach a given band. Third, the tables offer no cross-tabulation, so a difference between the two published groups may reflect differences in their mix of first languages, test purposes or destinations rather than anything about the groups themselves, and the comparison is an association, not an explanation. Fourth, means are quoted to two decimals from published three-decimal values, so a recomputation can move a difference by 0.01, which matters when the differences are this small.
What this means for learners
A group average is a poor guide to an individual band, and in these tables the difference between the two published groups is smaller than the difference between two skills inside either one. The practical signal is the skill profile: Writing sits at the bottom in Academic and Reading at the bottom in General Training, for both groups. Practice time aimed at the weakest section is the lever a candidate controls, and speaking is worth measuring separately because it is reported separately. Practice feedback is a study aid, not an official band, and Hibay does not issue IELTS scores.
Frequently Asked Questions
Is there a difference between male and female IELTS band scores? In the 2024-2025 tables the overall band averaged 6.25 for female candidates and 6.19 for male candidates in Academic, a difference of 0.06, and 6.41 against 6.30 in General Training, a difference of 0.11 (see Results).
Which section shows the widest difference? General Training Writing and General Training Speaking, both at 0.15 of a band (6.20 against 6.05, and 6.46 against 6.31). In Academic no section differed by more than 0.11.
Which skill is weakest in each test type? Writing in Academic, at 5.96 and 5.89 for the two published groups, and Reading in General Training, at 6.08 and 6.02. That ordering holds for both groups in the tables.
Do these averages tell me what band I would get? No. They are group means from a workbook that publishes no candidate counts and no distributions, and an individual result depends on the four separate skill scores rather than on any group average.
How to cite
Hibay Product Team. (2026, October 30). IELTS 2024-2025: Male-Female Gap Under a Tenth of a Band. Hibay. https://www.hibay.ai/en/news/ielts-gender-score-gap-2024-2025
Figures are from the public sources listed below and may be cited with attribution.
References
- IELTS. IELTS test taker performance data 2024-2025 (mean scores by gender, Academic and General Training). https://ielts.org/cdn/ielts-downloadable-assets/ielts-research/ielts-research-data/ielts-test-taker-performance-data-2024-2025.xlsx. Accessed 2026-10-30.