
Two Test Populations: IELTS Academic vs General Training, 2024-2025
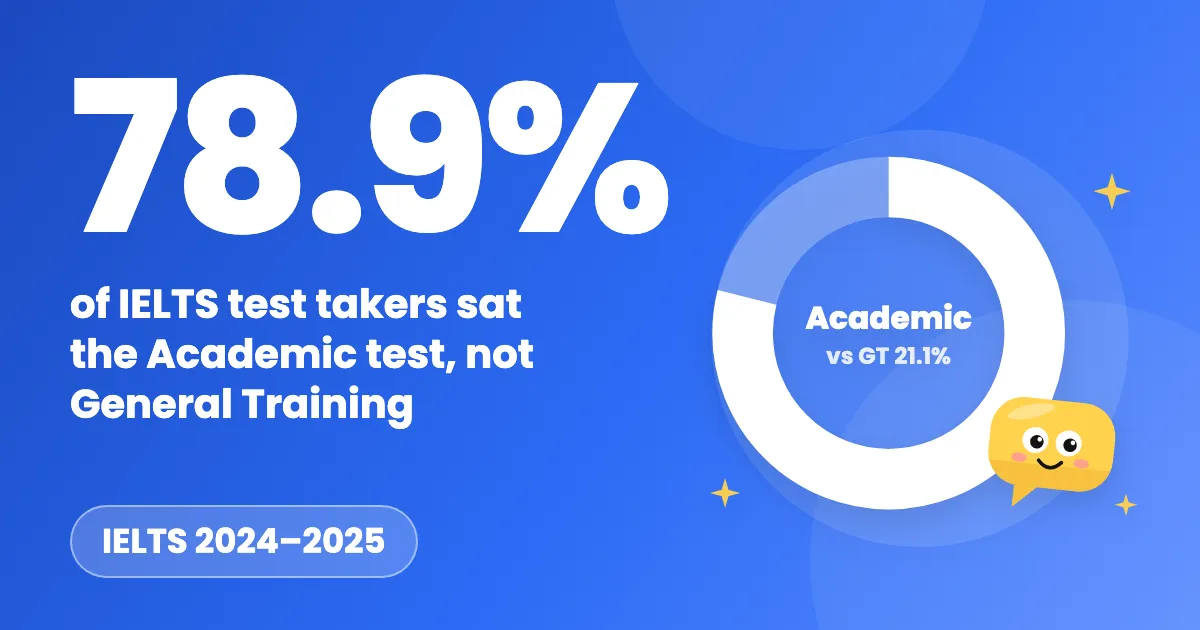
Official IELTS 2024-2025 statistics: Academic holds 78.9% of test takers, and in 22 of 30 shared nationalities General Training records a lower overall mean.

ໃນໜ້ານີ້
Test takers choose between IELTS Academic and IELTS General Training before they book, and the choice is often discussed as a question of difficulty. The IELTS Partners' 2024-2025 test taker performance statistics allow a direct comparison: the share of test takers each test holds, and the score profiles of the 40 nationalities and 40 first-language groups listed for each test. Academic accounted for 78.9% of test takers. Among the 30 nationalities listed for both tests, the General Training overall mean was lower in 22. The tables report group means only, with no counts behind each row.
Key findings
- Academic test takers made up 78.9% of the 2024-2025 cohort and General Training 21.1%, on the workbook's own test-split table [2].
- Only 30 of the 40 nationalities listed for Academic also appear in the General Training nationality table, and 33 of the 40 first-language groups appear in both.
- Among the 30 shared nationalities, the General Training overall mean was lower than the Academic mean in 22, higher in 7 and level in one (Ukraine, 6.59 both); the widest same-country gap was 0.96 band in the Philippines, 6.81 on Academic against 5.85 on General Training.
- Writing was the lowest of the four skill means in 31 of the 40 Academic nationalities; on General Training the lowest skill split between writing (19) and listening (18).
Background
IELTS publishes test taker statistics each year, and the current release covers 2024-2025 [1]. The partnership reports the two tests separately in one workbook, which is what makes a side-by-side reading possible: both are scored on the same nine-band scale, and the statistics page presents overall and skill-level band scores "according to a variety of classifications" [1]. That page notes the 2024-2025 figures are broadly in line with previous years [1]. Neither document describes who sits each test.
Data and method
This report uses two IELTS Partners documents, both covering 2024-2025: the test taker performance workbook [2] and the test statistics page that hosts it [1]. Five workbook sheets carry the analysis: Test split AC GT (two rows), AC mean by nationality and GT mean by nationality (40 rows each), and AC mean by first languages and GT mean by first languages (40 rows each). Two further sheets report means by gender and are used for one sentence.
Sample and inclusion. The workbook publishes aggregated group means: no individual records, no anonymized record-level data, and no statement of how many test takers sit behind any single row. Nothing here is re-weighted; the only arithmetic is subtraction between two published means and counting rows.
Metrics. The test-taker share is the percentage column of the split sheet, with a base of all test takers in that table. A group mean is the Overall result column, the average overall band of that nationality or first-language group. Lowest skill is a count made here: for each row the four skill means (Listening, Reading, Writing, Speaking) were compared and the lowest recorded; no row had a tie, so each of the 160 rows contributes one label. A same-country gap is the General Training overall mean minus the Academic overall mean for a nationality listed in both sheets.
Rounding. The workbook lists means to as many as nine decimal places and the test split to four. Means are rounded here to two decimals and shares to one decimal; gaps are computed from the unrounded workbook values and then rounded to two decimals.
Results
Academic is the larger group by a wide margin: of all test takers in the 2024-2025 split, 78.9% sat Academic and 21.1% sat General Training [2]. The workbook publishes no headcounts, so the share cannot be turned into candidate numbers, and says nothing about which countries supply each test.
The two tables do not describe the same set of places. Each nationality sheet lists 40 nationalities and only 30 appear in both. Ten are Academic-only: Azerbaijan, Cambodia, Jordan, Kazakhstan, Kuwait, Mongolia, Myanmar, Oman, the United Arab Emirates and Uzbekistan. Ten are General Training-only: Algeria, Argentina, Brazil, Cameroon, Chile, Mauritius, Peru, South Africa, the United States of America and Zimbabwe. The first-language tables overlap more, with 33 of the 40 groups listed for both. The official page notes these tables list top nationalities and languages alphabetically rather than by size [1], so a missing name sits outside the published set rather than proving nobody there sat that test.
Within the 30 shared nationalities, the General Training overall mean was lower than the Academic mean in 22, level in one (Ukraine, 6.59 both) and higher in seven. The gaps are uneven: eight nationalities sit 0.50 band or more below, thirteen between 0.05 and 0.49, seven within 0.05 either way, and two more than 0.05 above. The widest same-country gap is the Philippines, 6.81 on Academic against 5.85 on General Training, a gap of 0.96 band, followed by Saudi Arabia (5.85 against 4.94, 0.91). China runs the other way, 5.91 on Academic and 6.28 on General Training, 0.37 band higher.
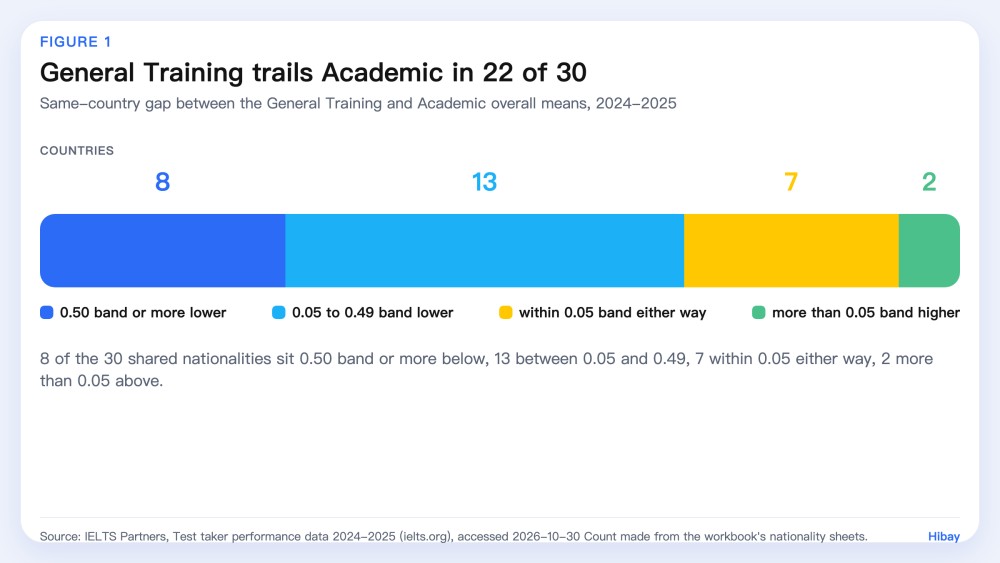
Figure 1. Distribution of the same-country gap between General Training and Academic overall means, counted across the 30 nationalities listed for both tests (n = 30 nationalities). Source: IELTS, Test taker performance data 2024-2025, nationality sheets.
The table below shows five shared nationalities, chosen to span the range of gaps rather than to rank them.
| Nationality | Academic overall | General Training overall | Gap (GT - AC) |
|---|---|---|---|
| Philippines | 6.81 | 5.85 | -0.96 |
| Indonesia | 6.68 | 5.83 | -0.85 |
| China | 5.91 | 6.28 | +0.37 |
| Germany | 7.57 | 7.23 | -0.34 |
| Japan | 5.82 | 5.79 | -0.04 |
The reading is in the last column: four of the five sit below zero, but the sizes differ by more than an order of magnitude, from 0.96 band in the Philippines to 0.04 in Japan.
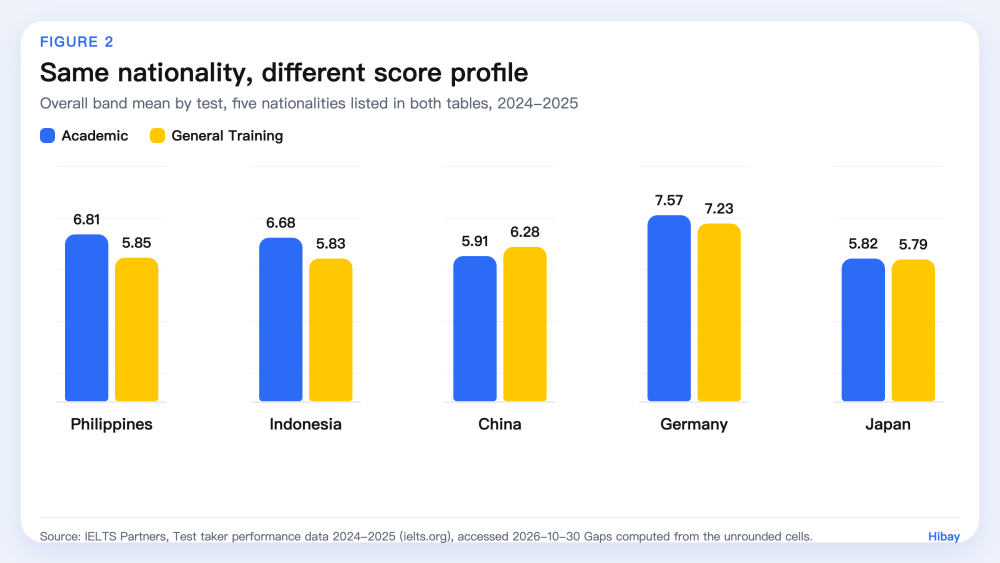
Figure 2. Overall band means by test for five nationalities listed in both tables, 2024-2025 (n = 5 nationalities). Source: IELTS, Test taker performance data 2024-2025, nationality sheets.
The weakest skill is where the two populations diverge most. In the Academic nationality table, writing was the lowest of the four skill means in 31 of 40 nationalities, listening in 5 and speaking in 4; reading in none. On General Training the split is different: writing in 19, listening in 18, speaking in 3, again no row with reading lowest. Across the four tables, 160 rows in total, reading was never the lowest skill. The first-language tables sharpen the contrast: writing was lowest for 33 of the 40 Academic language groups and listening for 3, while on General Training listening was lowest for 25 of 40 and writing for 11.
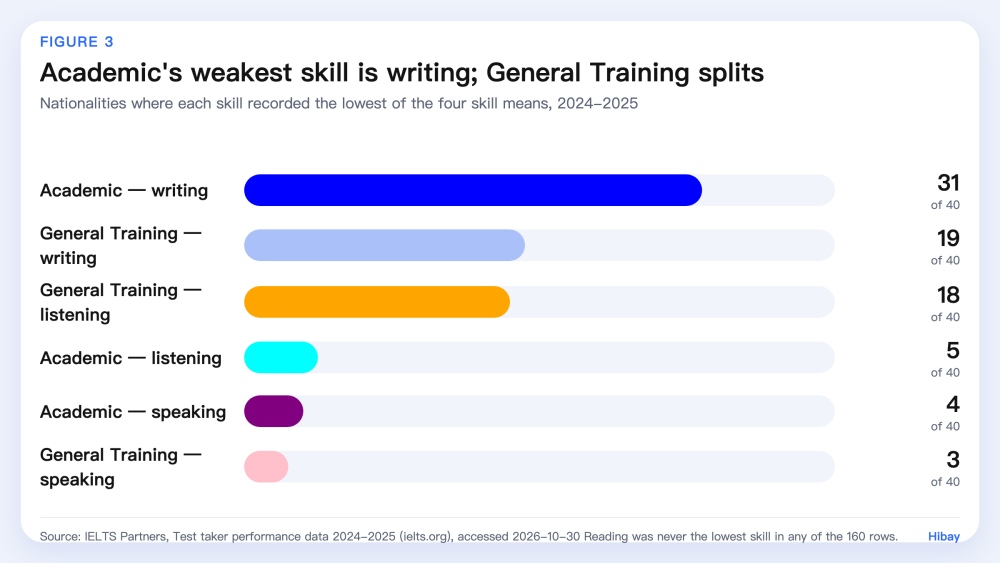
Figure 3. Number of nationality groups where each skill recorded the lowest of the four skill means, 2024-2025 (n = 40 nationalities per test). Source: IELTS, Test taker performance data 2024-2025, nationality sheets.
Comparing languages rather than countries does not change the direction: of the 33 groups listed for both tests, the General Training overall mean was lower in 23 and higher in 10. Same-language gaps run the same way as country gaps, Filipino at 6.81 on Academic against 5.87 on General Training, and Chinese at 5.95 against 6.32, the other way. Female test takers recorded a higher overall mean than male test takers on both tests, 6.25 against 6.19 on Academic and 6.41 against 6.30 on General Training, reported as published.
Limitations
Three limits shape how far these numbers travel. First, coverage: each table lists 40 nationalities and 40 language groups, drawn as the top sets and printed alphabetically [1], with no per-group counts. A nationality can be missing from one table while still supplying test takers to that test, so the overlap of 30 countries describes the published tables, not the two populations. Second, the figures are means of groups that differ in who they contain and why they sit the test; a same-country gap compares two different sets of people, and this data cannot say whether one test is easier or harder than the other. Third, measurement: the official page reports a standard error of measurement of 0.17 for the Academic test and 0.19 for the General Training test for composite scores [1]. Those are individual-level figures, not standard errors for the group means here, but they are a reminder that gaps of a few hundredths of a band, such as Japan's 0.04, carry little weight. The window is a single reporting year, so nothing here describes a trend.
What this means for learners
If you are choosing between the two tests, do not read the same-country gaps as a difficulty ranking: they compare different groups of people. Read the skill profile instead. On Academic, writing carried the lowest mean in 31 of 40 nationalities, while on General Training listening was lowest almost as often as writing. Aim practice at the skill that scores lowest for you on the test you will actually sit, and treat group means as background. Hibay's practice feedback is a study aid, not an official band score.
Frequently Asked Questions
Is IELTS Academic harder than General Training? The published statistics cannot answer that. The General Training overall mean is lower in 22 of the 30 shared nationalities, but each figure comes from a different set of test takers.
What share of IELTS test takers take Academic? 78.9% in 2024-2025, against 21.1% for General Training. The workbook gives the split as a percentage of all test takers and publishes no candidate counts.
Which skill has the lowest mean on Academic IELTS? Writing, in 31 of the 40 nationalities listed for Academic. Listening was lowest in 5 and speaking in 4; reading was never the lowest.
Do the same countries appear in both tables? No: 30 of the 40 nationalities appear in both. The tables list top nationalities alphabetically [1], so a missing country does not mean nobody there sat that test.
What about first languages? 33 of the 40 language groups appear for both tests. Writing was the lowest mean for 33 of the 40 Academic groups, while on General Training listening was lowest for 25 of 40.
How to cite
Hibay Product Team. (2026, October 30). Two Test Populations: IELTS Academic vs General Training, 2024-2025. Hibay. https://www.hibay.ai/en/news/ielts-academic-vs-general-training-2026
Figures are from the public sources listed below and may be cited with attribution.
References
- IELTS. Test statistics. https://ielts.org/teaching-and-research/test-statistics. Accessed 2026-10-30.
- IELTS. IELTS test taker performance data 2024-2025 (XLSX). https://ielts.org/cdn/ielts-downloadable-assets/ielts-research/ielts-research-data/ielts-test-taker-performance-data-2024-2025.xlsx. Accessed 2026-10-30.