
Recognition Over Price: IELTS Voices 2026, 8,395 Test Takers
A survey of 8,395 IELTS test takers across 165 countries: what drove test choice, which requirements were hardest to understand, and what preparation changed.

នៅលើទំព័រនេះ
This report looks at how people choose an English language test and what they say they struggled to understand once they had chosen one. It draws on IELTS Voices 2026, a survey of 8,395 recent and prospective IELTS test takers across 165 countries, run by the IELTS partners between 19 March and 17 April 2026 [1][2]. Given a single priority, 82% chose a test accepted by the widest range of universities and authorities, while 89% said achieving their goals mattered as much as or more than choosing the cheapest option. All figures are self-reported by IELTS test takers only, and they describe perceptions and intentions rather than measured outcomes.
Key findings
- Of 7,989 respondents given a single choice, 82% prioritized a test accepted by the widest range of universities and authorities, 11% a test seen as the most secure and reliable, and 7% the fastest results.
- 89% said that achieving successful outcomes was equally or more important than choosing the cheapest test option, and 41% would choose the test they believed gave the best chance of success even if it cost more.
- The hardest requirement to understand was the minimum English score, named by 28% of 3,830 respondents, ahead of different application routes at 25%, the validity period of test scores at 24% and visa rules at 24%.
- 67% of 6,194 respondents reported improved speaking confidence, academic or workplace writing, or both, after preparing for IELTS, and 65% of 6,347 rated preparation 7 or higher on a 0-10 helpfulness scale.
- Study was the reason for taking IELTS given by 63% of the 8,395 respondents, and among study-purpose respondents 44% said a university website listing IELTS was what helped them decide to book.
Background
Test takers compare requirements more often than experiences: which institutions accept a test, what score each one asks for, and how long that score stays valid. Destination rules moved in 2025 and 2026, including higher student visa charges in Australia and higher English language standards in the UK, which puts more weight on information that is clear and consistent [1]. Globally, speaking is the weakest English skill in a majority of the 123 countries and regions covered by the largest public index of adult English skills [3].
Data and method
All figures come from IELTS Voices 2026, published by the IELTS partners (the British Council, IDP IELTS and Cambridge University Press & Assessment), and from the news release that accompanies the report [1][2]. It was an online survey, conducted between 19 March and 17 April 2026, that took approximately 15 minutes to complete; respondents were recruited through IDP IELTS, British Council and IELTS USA networks.
The sample is 8,395 respondents from 165 countries. Base sizes differ by question and are printed in the report: 7,989 answered the test-choice question, 7,838 the question comparing cost with outcomes, 3,830 the question on requirements, 6,194 the question on preparation benefits and 6,347 the helpfulness rating. "Recent" respondents had taken IELTS within the past two years and "prospective" respondents planned to take it. The published results are aggregated answers only, and no individual respondent can be identified in them.
A share here is the percentage of respondents selecting an option out of the base printed for that question, which is why multiple-response questions do not sum to 100% while single-response questions do. Two counts are added up row by row from the demographics chart: the ten largest nationality groups account for 4,087 of the 8,395 respondents, or 48.7% of the sample, and India alone accounts for 973 of them, or 11.6%.
Results
Recognition was the biggest single factor in test choice. Of the 7,989 respondents asked to pick one priority, 82% chose a test accepted by the widest range of institutions and authorities, 11% a test seen as the most secure and reliable and 7% the fastest results.
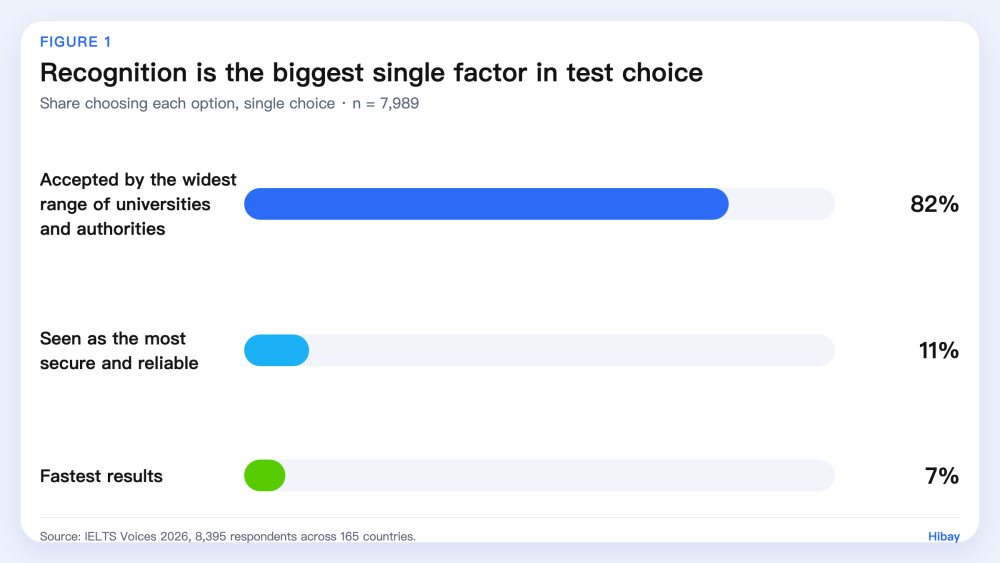
Figure 1. Share of respondents choosing each priority when picking an English language test, n = 7,989. Source: IELTS Voices 2026 [1].
Study applicants kept their options open in the same way: 42% of study-purpose respondents said they would consider more than one study destination, and 44% said seeing IELTS listed on a university or institution website was what helped them decide to book.
Cost came second to the likelihood of a usable result. Of 7,838 respondents choosing between two accepted tests, 48% said cost and achieving their goals were equally important, 41% would choose the test they believed gave the best chance of success even if it cost more, and 11% would choose the cheaper test even with less confidence in the outcome; the IELTS partners summarize the first two groups as 89%.
The hardest parts were the rules around the test rather than the test itself. Minimum English score requirements were named by 28% of the 3,830 respondents who answered the question, followed by different application routes at 25%, the validity period of test scores at 24%, visa rules related to English testing at 24% and which tests are required for a particular application at 15%.
| Requirement hardest to understand | Share | Base |
|---|---|---|
| Minimum English score requirements | 28% | n = 3,830 |
| Different application routes (study, work, migration) | 25% | n = 3,830 |
| Validity period of test scores | 24% | n = 3,830 |
| Visa rules related to English testing | 24% | n = 3,830 |
| Which tests are required for my application | 15% | n = 3,830 |
Read the column as a share of the 3,830 respondents who answered this question, not as a share of all test takers. The five items were offered as a multiple-response list, so the shares do not add to 100%.
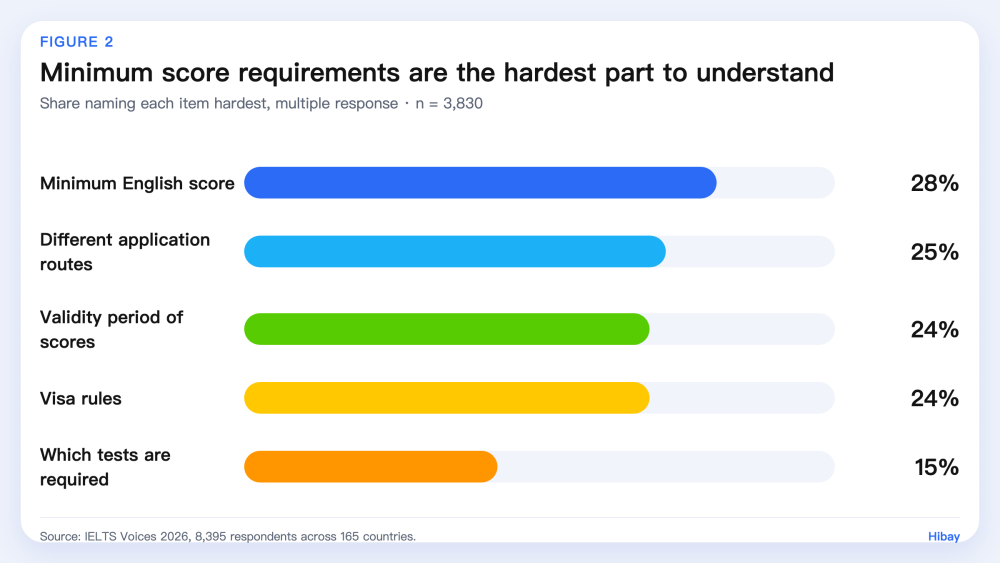
Figure 2. Share naming each part of the English language requirements as hardest to understand, n = 3,830. Source: IELTS Voices 2026 [1].
Preparation was the part of the process respondents reported benefiting from most. Of 6,194 respondents, 67% reported improved speaking confidence, academic or workplace writing, or both; 34% reported more confidence using English daily; 30% better comprehension of instruction and materials; 29% more confidence applying internationally; and 25% better time management. On the 0-10 helpfulness scale, 65% of 6,347 rated preparation 7 or higher for the skills their goals require, rising to 68% among respondents taking IELTS for study and 68% among those taking it for work, and 57% among those pursuing permanent residency or migration.
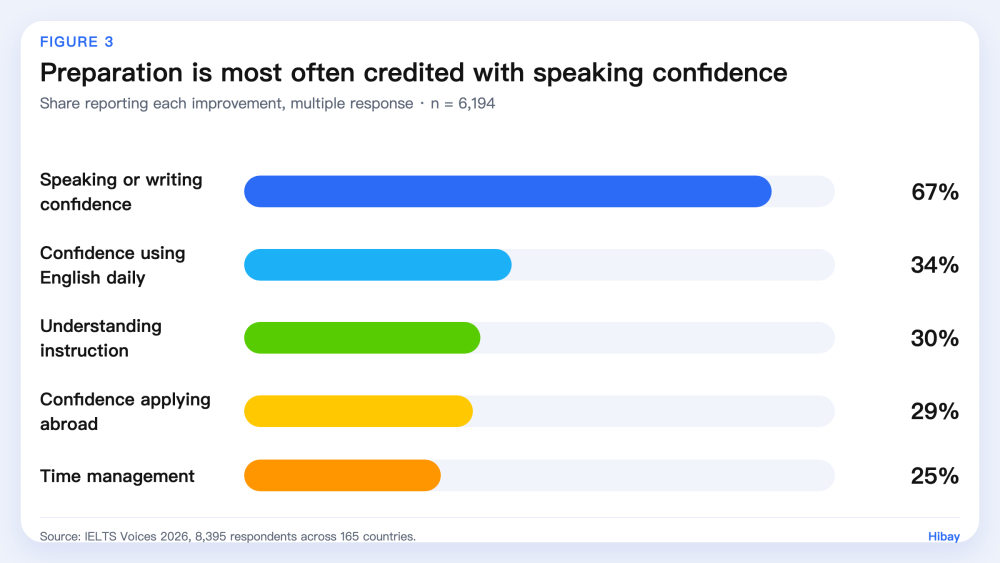
Figure 3. Share reporting each improvement after preparing for IELTS, n = 6,194. Source: IELTS Voices 2026 [1].
Study was the most common purpose: 63% of the 8,395 respondents took or planned to take IELTS for study, 15% for permanent residency or migration, 13% for work, 7% for professional registration and 2% for other reasons. Intended length of stay varied inside that group, with 41% of study respondents in India planning to stay three to five years in their destination country against 26% in China, and so did understanding, with 31% of respondents from China and Taiwan finding visa-related English-language requirements difficult to understand and 36% of applicants from Pakistan and Nigeria finding test score validity unclear.
Limitations
Four limits apply. First, all figures are self-reported: respondents described their own perceptions and intentions, not measured ability or outcomes, so a high helpfulness rating is an opinion about preparation rather than evidence of a score gain. Second, the survey records intentions, and what respondents said they would prioritize may differ from what they did when booking. Third, this is not a random sample of English learners: recruitment ran through IELTS partner networks and every respondent had taken IELTS within the past two years or planned to take it, so the group is more engaged with testing than English learners in general, and the answers cannot be extended to other tests or to learners more broadly. Fourth, the sample is unevenly distributed, with the ten largest nationality groups supplying 48.7% of respondents and India alone 11.6%, and the report does not print a base for every subgroup it quotes. The data is also a snapshot from March and April 2026, taken while several destinations were changing their rules.
What this means for learners
Three practical points follow. Check recognition before cost: since 82% of respondents put breadth of acceptance first, the list of institutions and authorities that accept a test, and the minimum score each one asks for, decides whether a result is usable at all, and a cheaper test accepted in fewer places is not cheaper in practice. Settle the details respondents found hardest — the minimum score, the validity period and what the visa route requires — before booking rather than after. And treat preparation as skill building rather than a formality: 67% of respondents reported that preparing improved speaking confidence, academic or workplace writing, or both. Tools such as Hibay can give repeated feedback on speaking between study sessions, but practice feedback is not an official test result and does not predict a band score.
Frequently Asked Questions
What matters most to people choosing an English test? Recognition. Given a single choice, 82% of 7,989 respondents picked a test accepted by the widest range of universities and authorities, well ahead of the 11% who prioritized security and reliability and the 7% who prioritized speed (see Results).
Do test takers choose the cheapest test? Mostly not. Of 7,838 respondents, 48% said cost and achieving their goals were equally important and 41% would pay more for the test they believed gave the best chance of success, while 11% would choose the cheaper option with less confidence in the outcome (see Key findings).
What do test takers find hardest to understand? The rules rather than the test. Minimum English score requirements were named by 28% of 3,830 respondents, different application routes by 25%, and score validity and visa rules by 24% each (see Data and method for the base).
Does preparing for IELTS improve speaking? Respondents report that it does: 67% of 6,194 said preparing improved their speaking confidence, academic or workplace writing, or both, and 65% of 6,347 rated preparation 7 or higher on a 0-10 scale. These are self-reported improvements, not measured score gains (see Limitations).
How to cite
Hibay Product Team. (2026, October 30). Recognition Over Price: IELTS Voices 2026, 8,395 Test Takers. Hibay. https://www.hibay.ai/en/news/ielts-voices-2026-recognition
Figures are from the public sources listed below and may be cited with attribution.
References
- IELTS Partners (British Council, IDP IELTS, Cambridge University Press & Assessment). IELTS Voices 2026: Insights into the motivations, experiences and outcomes of English language test takers. https://ielts.org/cdn/ielts-downloadable-assets/ielts-research/ielts-research-reports/ielts-voices-2026-research-report.pdf. Accessed 2026-10-30.
- IELTS. Recognition matters most as globally mobile test takers keep options open, IELTS research finds. https://ielts.org/news-and-insights/recognition-matters-most-as-globally-mobile-test-takers-keep-options-open-ielts-research-finds. Accessed 2026-10-30.
- EF Education First. EF English Proficiency Index 2025. https://www.ef.com/assetscdn/WIBIwq6RdJvcD9bc8RMd/cefcom-epi-site/reports/2025/ef-epi-2025-english.pdf. Accessed 2026-10-30.