
Where Do IELTS Skills Sit Apart? Official Test Statistics, 2024-2025
Official 2024-2025 IELTS data: speaking trails listening in 23 of 40 nationality groups, and writing is the lowest skill in 31 of 40.

នៅលើទំព័រនេះ
This report compares the four scored IELTS skills using the official test taker performance data for 2024-2025 published by IELTS. It covers 40 nationality groups and 40 first-language groups in IELTS Academic, plus the same groups in General Training. The clearest pattern is a split rather than a single weak skill: in 23 of the 40 Academic nationality groups, average speaking scores were lower than average listening scores, while writing was the lowest of the four skills in 31 groups. The published tables report group averages only, so nothing here describes an individual test taker.
Key findings
- In 23 of the 40 IELTS Academic nationality groups in 2024-2025, the average speaking band was lower than the average listening band.
- Writing averaged 5.98 across the same 40 groups, the lowest of the four skills, and was the lowest skill in 31 of the 40 groups.
- Among first-language groups, Chinese speakers averaged 5.54 in Academic speaking against 6.24 in listening, a gap of 0.70 of a band; Japanese speakers averaged 5.45 in speaking, the lowest speaking average in the report.
- Speaking is not universally the weaker skill: Ghana averaged 7.06 in speaking against 6.11 in listening, and Nigeria averaged 7.08 against 6.36.
- In the General Training tables, speaking fell below listening in only 10 of the 40 nationality groups, while writing was the lowest skill in 19.
Background
IELTS reports band scores for listening, reading, writing and speaking separately, and universities, employers and immigration authorities routinely read them as separate evidence of ability [1]. Test takers therefore make decisions about what to practice from a four-part score profile, not from the overall band alone. At the same time, the largest public index of adult English skills, the EF English Proficiency Index, reported in its 2025 edition that speaking is the weakest of the four skills in more than half of the 123 countries it measures [3]. The question this report asks is narrower and more checkable: in the official 2024-2025 IELTS tables, how often does each skill actually sit at the bottom.
Data and method
All figures come from the official IELTS test taker performance data for 2024-2025, published as a spreadsheet on the IELTS research site and downloaded in October 2026 [2]. The workbook reports mean band scores for listening, reading, writing, speaking and overall, separately for IELTS Academic and IELTS General Training, and separately for nationality and first language.
The sample is not a sample of candidates: it is the 40 published nationality rows and the 40 published first-language rows for each test type. Scores are published only as aggregated group means, and no individual candidate record appears in this source, so there is nothing here that can be traced back to a person.
Two counting rules matter for reading this report. A group is counted as having speaking below listening when its published speaking mean is lower than its published listening mean; the count is of groups, not of people. An average across groups is an unweighted mean of the 40 published group means, because the workbook does not publish the number of test takers behind each group, so a headcount-weighted average cannot be computed from this source. Group means were rounded to two decimals after averaging, so a difference computed from the rounded means can differ slightly from the difference of the unrounded values.
The workbook lists the top nationalities and first-language groups alphabetically rather than by size, and it does not disclose how many test takers each row represents. Any statement here about "countries" or "language groups" therefore refers to the published rows, not to the full IELTS population.
Results
Speaking sat below listening in 23 of the 40 Academic nationality groups. The gap is largest in East and Southeast Asian groups in this dataset: Vietnam averaged 5.61 in speaking against 6.49 in listening, a difference of 0.88 of a band, and China averaged 5.50 against 6.21, a difference of 0.71. Korea averaged 5.87 against 6.51 and Japan 5.47 against 5.99.
Writing, not speaking, was the most common weakest skill. It was the lowest of the four in 31 of the 40 Academic nationality groups, with an unweighted mean of 5.98, below reading at 6.69, listening at 6.42 and speaking at 6.35. Among first-language groups the pattern repeats more strongly: writing was the lowest skill in 33 of 40 groups, and speaking was below listening in 22 of 40.
The direction reverses in a minority of groups. Ghana averaged 7.06 in speaking and 6.11 in listening; Nigeria averaged 7.08 and 6.36; Swahili first-language test takers averaged 6.92 in speaking and 6.27 in listening. In these groups speaking is the stronger productive skill, which is why a single global claim such as "speaking is the hardest skill" does not survive contact with the tables.
General Training behaves differently from Academic. Speaking fell below listening in 10 of the 40 nationality groups, and writing was the lowest skill in 19, so the writing weakness is less uniform in the General Training population.
| Group (Academic) | Listening | Speaking | Speaking minus listening |
|---|---|---|---|
| All 40 nationality groups, unweighted mean | 6.42 | 6.35 | -0.07 |
| China | 6.21 | 5.50 | -0.71 |
| Japan | 5.99 | 5.47 | -0.52 |
| Korea, Republic of | 6.51 | 5.87 | -0.64 |
| Ghana | 6.11 | 7.06 | +0.95 |
Read the table by column, not by rank: the first row averages 40 group means, while the rows below are single groups, and the group rows are not a ranking of countries by overall ability.
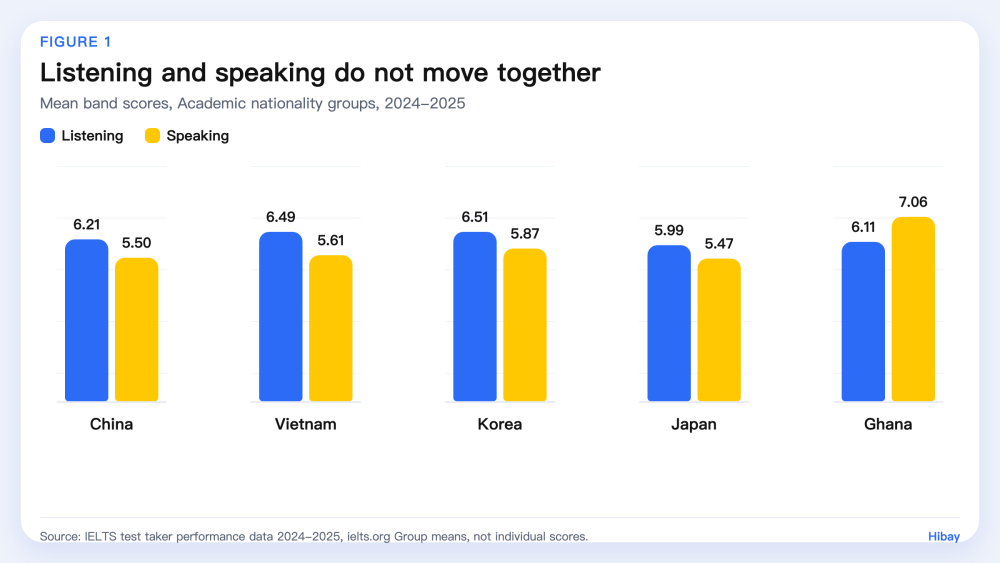
Figure 1. Mean listening and speaking bands for five of the 40 published Academic nationality groups. Source: IELTS test taker performance data 2024-2025 [2].
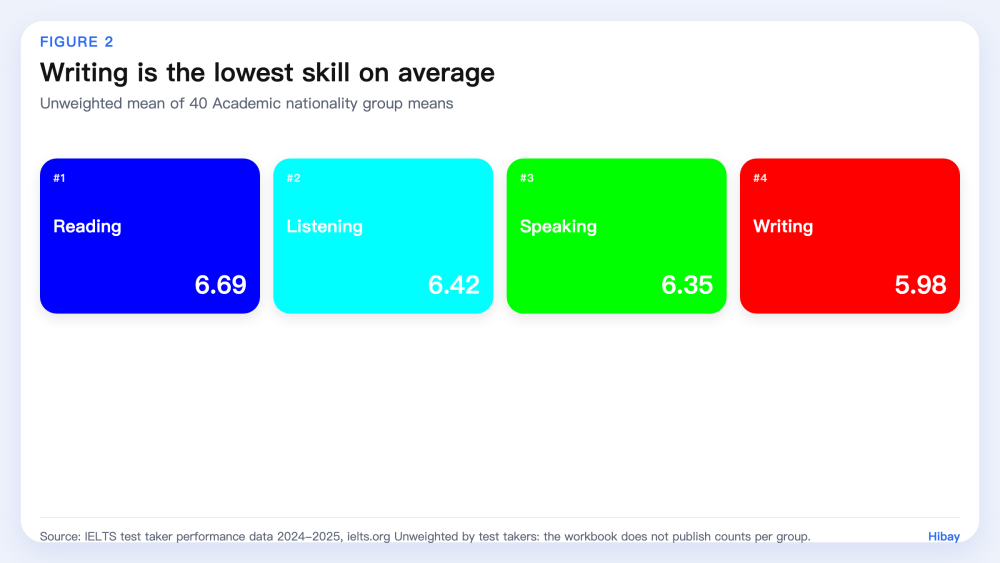
Figure 2. Unweighted means of the 40 published Academic nationality group means, n = 40 groups. Source: IELTS test taker performance data 2024-2025 [2].
Limitations
Four limits apply. First, the workbook publishes only the top nationalities and first-language groups, listed alphabetically, and gives no test taker counts per row, so these means cannot be weighted by population and should not be read as global averages of all IELTS candidates. Second, every figure is a group mean: it says nothing about the distribution within a group, and a group mean can hide a wide spread of individual scores. Third, band scores are not measured without error. IELTS reports the standard error of measurement for the listening section as 0.43 of a band, with a standard deviation of 1.36 [1], which means differences smaller than that between two group means are close to the noise floor of the instrument. Fourth, this is a single testing year: the same tables for other years are needed before any trend can be claimed, and the EF index explicitly notes that changes to its own method limit year-on-year comparison [3].
What this means for learners
Read your own score profile before choosing what to practice. If your listening band sits well above your speaking band, extra listening input is unlikely to move speaking, because in 23 of the 40 Academic nationality groups the two skills did not travel together in 2024-2025. Budget preparation time for writing as well: it was the lowest skill in 31 of the 40 groups, more often than speaking. For speaking itself, the useful unit of practice is a recorded answer reviewed against the official band descriptors, since the descriptors define what the examiner scores. Tools such as Hibay can give fast feedback on pronunciation and fluency between sessions, but practice feedback is not an official IELTS result and does not predict a band score.
Frequently Asked Questions
Is speaking the hardest IELTS skill? No, not by these tables. Writing was the lowest of the four skills in 31 of the 40 Academic nationality groups, while speaking was the lowest in a minority of groups, and in Ghana, Nigeria and Swahili first-language groups speaking averaged higher than listening.
How large is the gap between listening and speaking? It depends on the group. Vietnam showed the widest gap among the published rows at 0.88 of a band, China 0.71 and Korea 0.64, while the unweighted average across all 40 Academic nationality groups was 0.07 of a band in favor of listening.
Do these numbers apply to General Training too? Only partly. In General Training, speaking fell below listening in 10 of 40 nationality groups and writing was the lowest skill in 19, so the writing weakness appears in both tests but is less uniform in General Training.
Can I estimate my band from a practice app? No. These tables describe group averages from official tests, and app-based practice feedback measures different things from the four IELTS criteria; use it to find what to work on, not to estimate a score.
How to cite
Hibay Product Team. (2026, October 29). Where Do IELTS Skills Sit Apart? Official Test Statistics, 2024-2025. Hibay. https://www.hibay.ai/en/news/ielts-skills-gap-2024-25
Figures are from the public sources listed below and may be cited with attribution.
References
- IELTS. Test statistics: test taker performance 2024-2025. https://ielts.org/researchers/our-research/test-statistics. Accessed 2026-10-29.
- IELTS. Test taker performance data 2024-2025 (XLSX). https://ielts.org/cdn/ielts-downloadable-assets/ielts-research/ielts-research-data/ielts-test-taker-performance-data-2024-2025.xlsx. Accessed 2026-10-29.
- EF Education First. EF English Proficiency Index 2025 launched: AI-Powered Insights Reveal Global Language Shifts in a Fragmented World. https://www.ef.edu/about-us/press/articles/2025/ef-english-proficiency-index-2025-launched/. Accessed 2026-10-29.