
0.73 Is a Correlation, Not a Conversion: Duolingo English Test Concordance, 2025
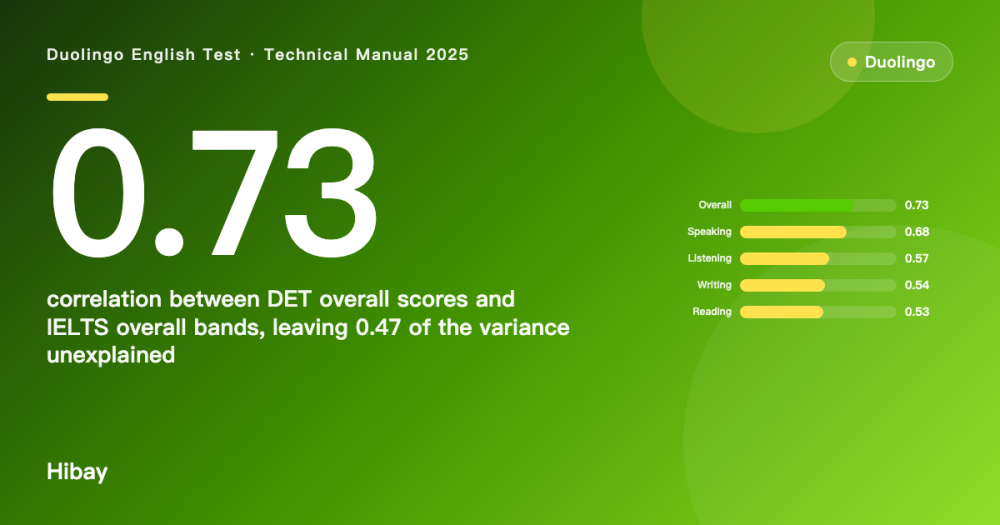
Duolingo publishes concordance tables that let a Duolingo English Test score stand in for an IELTS band. The test maker's own 2025 manual gives the correlations behind them: 0.73 overall, and 0.53 to 0.68 for the four subscores.

On this page
Concordance tables exist so that one test score can be read in another test's units. Duolingo's 2025 technical manual publishes the statistics behind its own tables, which makes it possible to ask how tight the mapping actually is. The correlation between Duolingo English Test overall scores and IELTS overall bands is 0.73, which leaves 0.47 of the variance in one score unexplained by the other. This report reads the manual's correlation and sample-size tables; every figure is an aggregate over candidates who took both tests, and none of it does more than describe a population.
Key findings
- The Pearson correlation between the two overall scores is 0.73, so DET overall scores account for 0.53 of the variance in IELTS overall bands and leave 0.47 unexplained.
- The four subscores map far more loosely than the overall scores: Speaking 0.68 against IELTS Speaking, Listening 0.57, Writing 0.54 and Reading 0.53.
- The 2024 subscore study rests on 1,943 usable IELTS score reports against a recommended minimum of 1,500, split into 591 candidates who took the DET first and 1,352 who took IELTS first.
- The DET's own measurement error is substantial in its own units: Listening has an SEM of 8.73 points and Reading 7.17, against an interquartile range of 25 points across all test takers.
Background
An admissions office that accepts both tests needs a rule for reading one score in the other's units, and a concordance table is that rule. Building one requires candidates who sat both tests, a statistical model that maps the two score distributions onto each other, and a sample large enough for the mapping to be stable.
The two scales are not shaped alike. The DET reports a single score on a scale from 10 to 160, in 31 possible values. IELTS reports bands from 1 to 9, with 19 possible scores once half-bands are counted. The TOEFL iBT, the third test in the manual's comparisons, has 121 unique values. That difference matters for what a conversion can promise: the fewer distinct points a scale has, the more candidates crowd into each point, and the easier it is to say which band a given score corresponds to.
A correlation coefficient answers a different question from a concordance table. The correlation says how strongly two scores move together across candidates; the table says which value of one is equivalent in distribution to which value of the other. A high correlation is a precondition for a usable table, not a substitute for one.
Data and method
Source and window. The figures come from the Duolingo English Test Technical Manual of July 2025: the relationships-with-other-tests section, its sample-size table and its correlation table, together with the test-retest reliability table and the score-distribution section [1]. The 2024 subscore study covers certified DET sessions from 3 April 2024 to 30 September 2024 with associated IELTS score reports; the reliability and distribution figures cover 1 July 2024 to 30 June 2025.
Sample. The subscore study collected 1,943 usable IELTS score reports: 591 from candidates who took the DET before the IELTS and 1,352 who took the IELTS before the DET. Candidates had to take the two tests no more than 90 days apart. The earlier overall concordance study, run in 2022, used 328 official TOEFL reports and 1,643 official IELTS reports, plus 1,095 self-reported TOEFL scores and 4,420 self-reported IELTS scores. Duolingo cites 1,500 as the recommended minimum sample for building a concordance table.
Definitions. A correlation here is a Pearson coefficient between the two scores for the same candidate. Equating was done with kernel equating, chosen over equipercentile after comparison, with a correction for reporting bias applied to self-reported scores. The standard error of measurement is the within-person variability estimated from a test-retest study, and the interquartile range is the span covering the middle half of test takers. Every value is an aggregated statistic published by the test maker: a correlation is a count of candidate pairs, and an average such as the score mean is a share-weighted aggregate across all test takers; no candidate-level record is involved.
Results
The overall correlation of 0.73 is the strongest number in the manual's comparison tables and the weakest basis for a conversion. Squared, it means DET overall scores account for 0.53 of the variance in IELTS overall bands. The other 0.47 is variation the DET does not capture: differences in what the two tests ask candidates to do, in the day, and in the candidates themselves.
The subscores are the softer part of the picture. Speaking correlates 0.68 with IELTS Speaking, which is close to the overall figure. Listening is 0.57. Writing is 0.54 and Reading 0.53, so a converted writing or reading subscore carries a great deal of unexplained variation. The manual is explicit about why the overall tables behave better than a naive reading would suggest: with 19 IELTS bands against 31 DET values, candidates with the same DET score very often share an IELTS band, while the 121-value TOEFL scale produces more cases where one DET score maps to several TOEFL scores and inflates the standard error of equating.
The DET's own precision sets a second ceiling. Test-retest reliability is high by conventional standards: 0.96 for the overall score with an SEM of 4.38 points, and between 0.87 and 0.95 for the eight subscores. But the SEMs are large in scale terms. Listening's is 8.73 points and Reading's 7.17, against an interquartile range of 25 points across all test takers, so Listening's error alone is about 35% of the middle half of the score distribution. The overall score distribution has a mean of 110.59 and a median of 110 on a scale that runs from 10 to 160.
Put together, the two layers say something simple. A concordance table built on a 0.73 correlation, applied to a test whose own Listening subscore moves by 8.73 points between sittings, is a population-level mapping. It answers "what does a score like this usually correspond to", not "what would this candidate have scored".
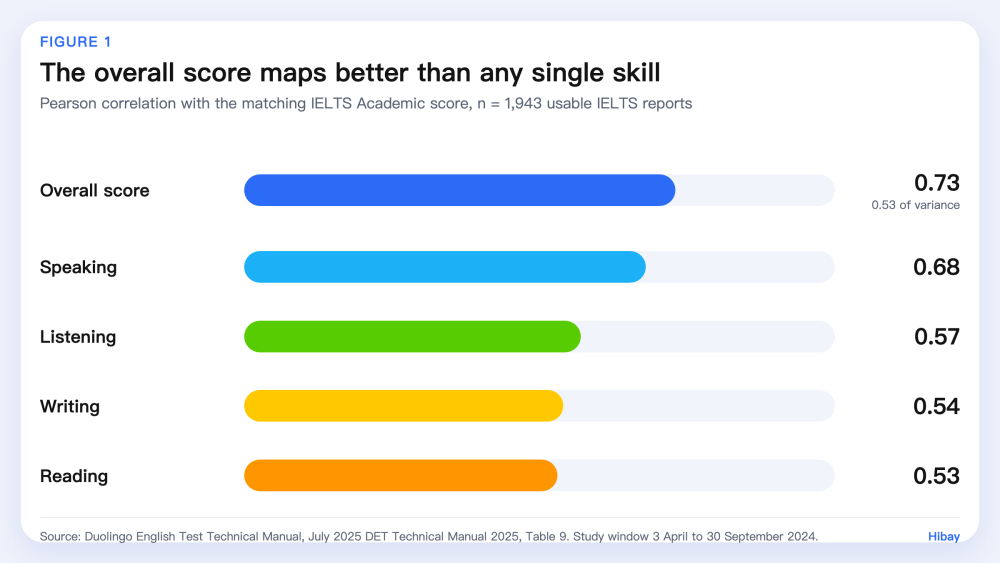
Figure 1. Pearson correlation between Duolingo English Test scores and the matching IELTS Academic scores, 3 April to 30 September 2024. n = 1,943 usable IELTS score reports. Source: DET Technical Manual 2025, Table 9.
Limitations
Four limits apply. First, the correlations come from candidates who chose to take both tests, who are not a random sample of either test population; candidates with a reason to certify twice may differ systematically from those who certify once. Second, the 2022 concordance work had to model self-reported scores before use, and a correction for reporting bias is an assumption rather than an observation, even though the manual reports that the corrected and official samples behaved similarly. Third, a concordance table maps distributions and cannot certify an individual score; two candidates with the same DET score can legitimately hold different IELTS bands. Fourth, the subscores are converted on correlations between 0.53 and 0.68, which is the weakest published link in the chain, and the manual prints the coefficients without confidence intervals around them.
What this means for learners
Choose a test for the requirement you have to meet, not for the conversion. If a university states an IELTS band and accepts the DET as an alternative, the useful question is which DET score that institution's own policy asks for, not what a table says your band would be. A converted score is a statement about a distribution.
The second consequence is about re-sits and about diagnosing a skill. If the subscores correlate between 0.53 and 0.68 and each carries several points of measurement error, then a converted writing or reading subscore cannot tell a learner which skill to work on. What can is repeated practice on the same skill with feedback on the specific thing being measured. Practice feedback is not an official score, and Hibay does not issue one.
Frequently Asked Questions
Is a Duolingo English Test score equivalent to an IELTS band? Only in the sense of a population mapping. The overall scores correlate 0.73, which leaves 0.47 of the variance unexplained, and the concordance table is built on that relationship. It does not certify what one candidate would have scored on the other test.
Why are the subscore correlations lower than the overall correlation? Overall scores aggregate four skills, so the parts of the two tests that measure the same construct reinforce each other and the shared error partly cancels. A single subscore has no such averaging: Writing correlates 0.54 and Reading 0.53 with their IELTS counterparts, against 0.68 for Speaking.
How much can a Duolingo English Test result move by chance? The manual's test-retest study puts the standard error of the overall score at 4.38 points and the eight subscores between 4.87 and 8.73 points, on a scale that runs to 160. A change of a few points between two sittings is therefore inside the measurement error.
Which test should I take if I need an IELTS band? Take the test whose score the receiving institution asks for. The concordance tables exist for institutions comparing applicants, not as a substitute for sitting the test a requirement names.
How to cite
Hibay Product Team. (2026, November 4). 0.73 Is a Correlation, Not a Conversion: Duolingo English Test Concordance, 2025. Hibay. https://www.hibay.ai/en/news/det-ielts-concordance-2025
Figures are from the public source listed below and may be cited with attribution.
References
- Duolingo. Duolingo English Test: Technical Manual, July 2025. Section 7.1 Relationships With Other Tests, Table 7 sample sizes, Table 9 correlations, section 6.3 and Table 5 reliability and SEM, section 9.2 score distribution. https://duolingo-papers.s3.us-east-1.amazonaws.com/other/technical_manual/DET_technical_manual_2025_07.pdf. Accessed 2026-11-04.