
A 100 Is the 74th Percentile: TOEFL iBT 2025 Score Tables
ETS 2025 percentile tables: a section score of 25 is the 82nd percentile in Speaking but the 57th in Reading, and a 100 total ranks differently by group.

في هذه الصفحة
Percentile tables turn a TOEFL iBT score into a position among everyone who took the test, and ETS publishes one table for each applicant type. This report reads the 2025 Test and Score Data Summary, which covers examinees who tested between January and December 2025, and compares the percentile attached to the same score across sections and across applicant groups. A total score of 100 was the 74th percentile overall, the 70th among graduate-level applicants and the 87th among two-year college applicants. The tables describe published group positions only, and ETS prints no examinee count for the summary.
Key findings
- In the 2025 total group, a section scale score of 25 was the 82nd percentile in Speaking but the 57th in Reading and in Listening, a spread of 25 percentile points for the same score [1].
- A total score of 100 was the 74th percentile across all examinees, the 70th among graduate-level applicants, the 72nd among undergraduate applicants and the 87th among two-year college applicants [1].
- Graduate-level applicants recorded the highest Reading and Listening means of the ten applicant groups, 23.1 and 23.2, and the highest total mean of 89; the lowest total mean, 77, belonged to two-year college applicants [1].
- Speaking has the narrowest spread of the four sections, a standard deviation of 4.7 against 6.6 for Reading, so one scale point in Speaking moves an examinee through more of the percentile scale [1].
Background
Applicants see four section scores and a total score, and programs frequently set a minimum for one section as well as for the total [1]. A scale score on its own does not say how common that score is: the same 25 means something different in each of the four sections, because the four distributions differ. Percentile ranks answer that question directly, and ETS prints them for the total group and for ten applicant types in the same document. ETS also attaches a caution to its region tables, warning that examinees are not representative of all English speakers in a country, so those tables should not be used to rank countries [1]. The narrower question here is how far percentile positions move within a year of published data.
Data and method
Source and window. All figures come from the ETS TOEFL iBT Test and Score Data Summary 2025, which reports test data for January to December 2025 [1].
Sample. The summary covers examinees who took the TOEFL iBT test in that window and prints 11 percentile tables: the total group plus 10 subgroups defined by the purpose each examinee stated. ETS publishes no examinee count for the summary, so no table in this article carries a sample size beyond the published table itself, and the region and native-language tables in the same document suppress means for subgroups of fewer than 30 examinees [1].
Definitions. A percentile rank reads as the share of that group who scored below a given score: a rank of 57 at a scale score of 25 means 57% of the group scored below 25. Section scores run from 0 to 30 and the total score from 0 to 120, and the total scale scores in these tables move in steps of 4 points, so a total of 100 corresponds to a section score of 25. A section mean is the average scale score of the group, and a group total mean is its average total score.
Processing and rounding. Only published, aggregated tables are used here; no individual test taker record is involved. Percentile ranks are quoted as printed, as whole numbers, and means and standard deviations are quoted to one decimal place as printed.
Design. The data are observational and descriptive of one testing year.
Results
Percentile ranks differ by section at the same scale score. In the 2025 total group, a section score of 25 was the 82nd percentile in Speaking, the 74th in Writing and the 57th in Reading and Listening; at a section score of 23 the ranks were 62 in Speaking, 58 in Writing, 46 in Reading and 45 in Listening. The reason is dispersion: Speaking scores are more tightly clustered, with a standard deviation of 4.7 against 6.6 for Reading, 6.3 for Listening and 4.9 for Writing, so a single scale point carries more weight in Speaking than in Reading. A candidate reading only a scale score can therefore overestimate a weak Speaking section and underestimate a strong Reading section.
A total score carries a different percentile in each applicant group, and the spread at a total of 100 is 17 percentile points between the highest and lowest published tables:
| Total score | All examinees | Undergraduate | Graduate | Two-year college |
|---|---|---|---|---|
| 80 | 31 | 30 | 25 | 48 |
| 92 | 55 | 53 | 49 | 71 |
| 100 | 74 | 72 | 70 | 87 |
| 108 | 91 | 90 | 89 | 97 |
Read the table down a column for one group, or across a row to see how the same total score sits differently between groups.
The groups themselves differ in level. Total-score means in the 2025 tables run from 77 for two-year college applicants and 80 for high school applicants to 89 for graduate-level applicants, with undergraduate applicants at 87, graduate business school applicants at 88, professional license, employment and immigration applicants at 84 and other applicants at 83. Because percentile is a position inside a group, the same total score lands higher where the group's average is lower: a 100 is the 87th percentile among two-year college applicants but the 70th among graduate-level applicants. Graduate-level applicants also posted the highest Reading and Listening means of the ten groups, 23.1 and 23.2, alongside a total mean of 89.
The applicant tables are not a hierarchy of difficulty. A total of 100 was the 82nd percentile among high school applicants and among students in English-language schools, the 80th among professional license applicants, the 78th among employment applicants and the 76th among immigration applicants, so the same score reads better or worse depending on which group an applicant belongs to rather than on how demanding the purpose sounds.
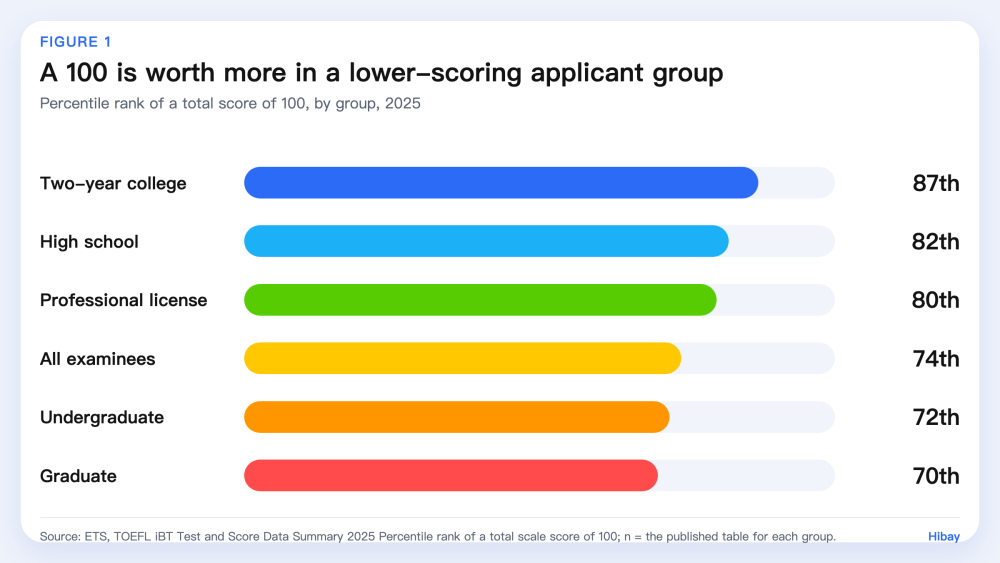
Figure 1. The percentile rank of a total score of 100 in six of the 2025 tables: two-year college applicants 87, high school applicants 82, professional license applicants 80, all examinees 74, undergraduate applicants 72 and graduate-level applicants 70. n = the published table for each group. Source: ETS, TOEFL iBT Test and Score Data Summary 2025.
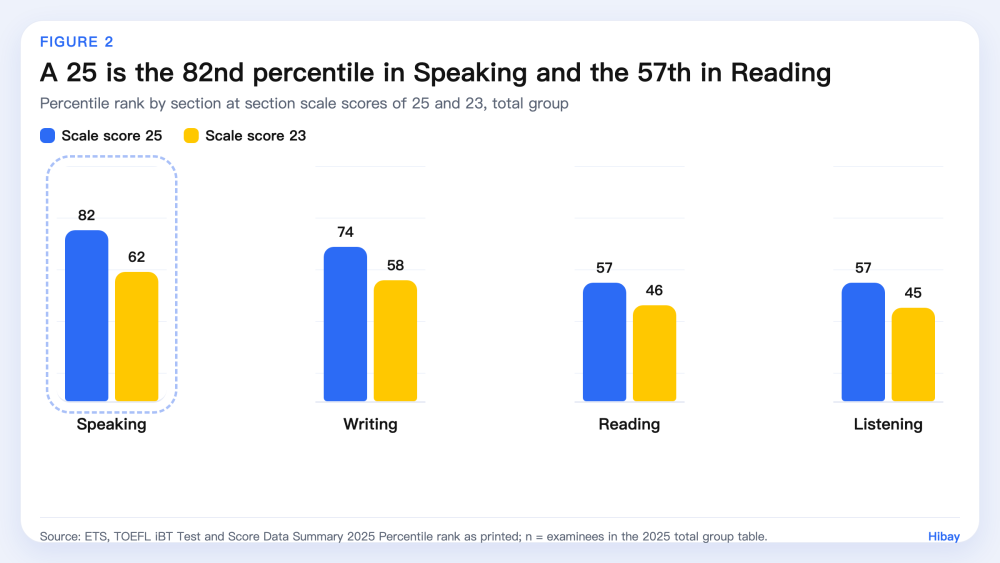
Figure 2. Percentile rank by section at section scale scores of 25 and 23 in the 2025 total group: Speaking 82 and 62, Writing 74 and 58, Reading 57 and 46, Listening 57 and 45. n = examinees in the published total group table. Source: ETS, TOEFL iBT Test and Score Data Summary 2025.
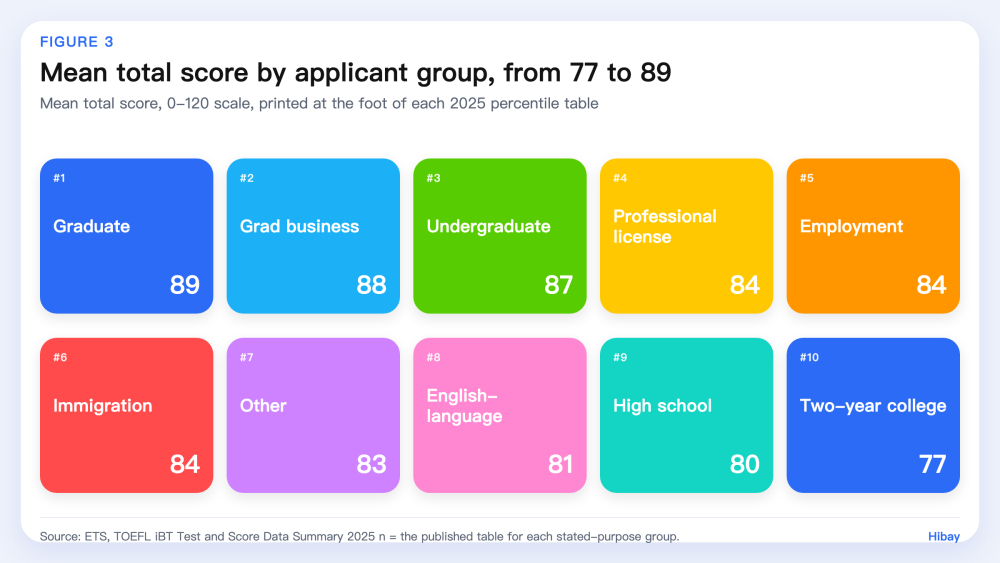
Figure 3. Mean total score for the ten stated-purpose groups, from graduate-level applicants at 89 to two-year college applicants at 77. n = the published table for each group. Source: ETS, TOEFL iBT Test and Score Data Summary 2025.
Limitations
Four limits matter. First, ETS prints no examinee count in this summary, so no percentile in this article has a sample size behind it, and differences of one or two percentile points between groups cannot be tested for reliability. Second, the applicant groups are defined by what each examinee stated when registering, which makes them self-selected populations of unknown size rather than random samples. Third, percentile position describes other test takers, not ability, and it says nothing about what any program requires: a program's minimum score is a policy figure that ETS does not publish here. Fourth, the window is a single calendar year, the tables are observational, and the composition of the test-taking population can shift between years, so these figures describe 2025 rather than forecast any later year.
What this means for learners
Percentiles are worth reading before a target score is chosen, because the same scale score sits in a different place in each section and each applicant group. A learner who needs 25 in one section is closer to the middle of the Reading distribution than of the Speaking distribution, which is where practice time has more room to move a percentile. Section-level practice is what a speaking tool can support; a practice score is feedback, not an official result, and Hibay does not issue TOEFL scores.
Frequently Asked Questions
What percentile is a TOEFL iBT total score of 100? In the 2025 total group it was the 74th percentile. Among two-year college applicants it was the 87th, among undergraduate applicants the 72nd and among graduate-level applicants the 70th (see Results).
Is a section score of 25 in Speaking better than a 25 in Reading? By percentile, yes: 25 was the 82nd percentile in Speaking and the 57th in Reading and in Listening in the 2025 total group. The scale is the same, but the distributions are not, so the same number carries a different position.
Which applicant group scores highest? Graduate-level applicants had the highest Reading and Listening means of the ten groups, 23.1 and 23.2, and the highest total mean, 89. Two-year college applicants had the lowest total mean, 77, which is why a 100 reads as the 87th percentile in that table.
Does a high percentile mean a program will accept the score? No. Percentile ranks are published positions among test takers. Each institution sets its own minimum, and ETS does not publish those thresholds in the summary.
How to cite
Hibay Product Team. (2026, October 30). A 100 Is the 74th Percentile: TOEFL iBT 2025 Score Tables. Hibay. https://www.hibay.ai/en/news/toefl-2025-percentile-ranks-by-applicant-group
Figures are from the public sources listed below and may be cited with attribution.
References
- ETS. TOEFL iBT Test and Score Data Summary 2025, January-December 2025 Test Data. https://www.es.ets.org/content/dam/ets-org/pdfs/toefl/toefl-ibt-test-score-data-summary-2025.pdf. Accessed 2026-10-30.