
TOEFL iBT 2025: Same Total Score, Different Section Profile
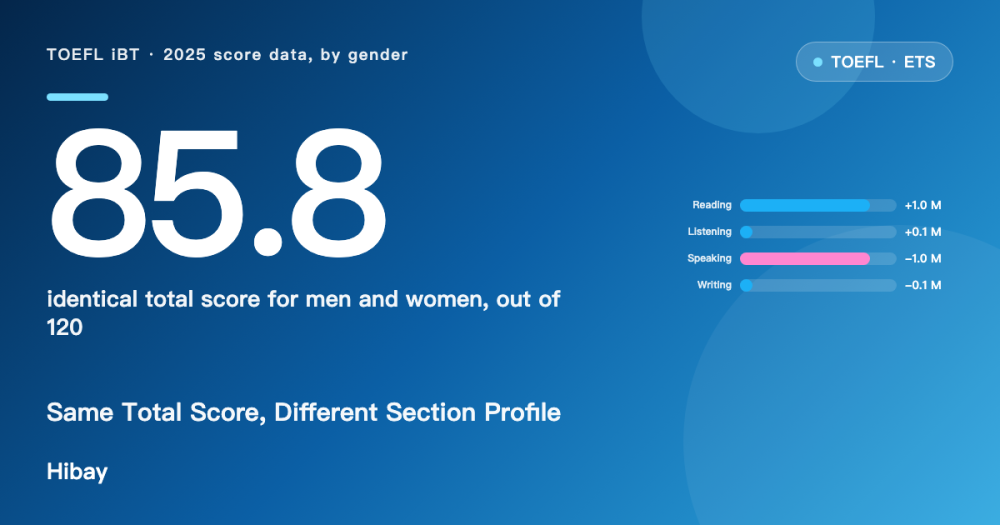
ETS 2025 tables show men and women averaging an identical TOEFL total of 85.8, while men lead reading by a full point and women lead speaking by a full point.

នៅលើទំព័រនេះ
A total score hides which sections produced it. ETS publishes the 2025 TOEFL iBT score summary with separate tables for male and female examinees and, inside each table, a breakdown by the reason the examinee took the test. Read together, those tables show two groups arriving at the same total from different profiles: male and female examinees both average 85.8 out of 120, but men average 22.4 in reading against women's 21.4, while women average 21.1 in speaking against men's 20.1. Purpose matters more than gender: totals by reason for testing run from 76.2 to 90.0. The tables cover examinees who answered the gender question, and ETS does not publish sample sizes for them.
Key findings
- Male and female examinees both average a total score of 85.8 out of 120 in the 2025 TOEFL iBT tables.
- Inside that identical total, men average 22.4 in reading and women 21.4, while women average 21.1 in speaking and men 20.1, so each group leads one of the two sections by exactly 1.0 point.
- Speaking is the lowest-scoring section in 16 of the 22 group-and-gender cells in the two tables, and tied for lowest in 2 more.
- Total scores by reason for testing spread 13.8 points for male examinees and 14.5 for female examinees, from 76.2 for two-year college applicants to 90.0 for graduate business applicants.
- The largest gender difference by purpose is immigration: men average 85.3 and women 83.3, a gap of 2.0 points, while applicants for licensure average 84.0 in both groups.
Background
The TOEFL iBT reports a section score from 0 to 30 for Reading, Listening, Speaking and Writing plus a total from 0 to 120, and the data summary covers everyone who sat the test between January and December 2025 [1]. Institutions usually set a total minimum and sometimes a section minimum, so a candidate whose total clears the bar can still be held back by one section; that is why the shape of a score, not only its size, decides whether a result is usable. ETS prints means by gender and by stated purpose for exactly this kind of comparison, and warns that the section and total means are group averages rounded to whole numbers.
Data and method
The source is the TOEFL iBT Test and Score Data Summary 2025, published by ETS, tables 2, 13 and 14 [1]. Table 2 gives percentile ranks and means for the total group; table 13 gives means and standard deviations for male examinees and table 14 for female examinees, each broken down by ten stated reasons for taking the test plus an "all" row. Data cover test takers who took the TOEFL iBT between January and December 2025.
Three definitions apply. A purpose total is the mean total score of examinees who gave that reason for testing, within one gender table. The gender gap for a purpose is the male mean minus the female mean, so a positive value means men scored higher in that group. The count of cells where speaking is lowest is my own count across the 11 rows of each table: for each of the 22 gender-and-purpose cells I compared the four section means and recorded whether Speaking was the single lowest, tied for lowest, or neither.
The sample behind each cell is every examinee who answered both the gender and the purpose question, and ETS prints no count for it. All figures are aggregated means; no individual examinee record is used. ETS rounds section and total means to whole numbers, so a difference of 0.1 in a table can be rounding rather than a real gap, and section means may not add up exactly to the total. The gender tables cover only examinees who answered the gender question, which is why their "all" totals are not identical to the total-group figure in table 2.
Results
The totals are identical and the profiles are not. Male examinees average 85.8 and female examinees 85.8, yet men average 22.4 in reading against women's 21.4 and women average 21.1 in speaking against men's 20.1.
Figure 1. TOEFL iBT section means by gender, scores out of 30, n = examinees who answered the gender question in 2025. Source: ETS TOEFL iBT Test and Score Data Summary 2025 [1].
Reading and speaking are the two sections that carry the difference, and they cancel out. Listening (22.1 against 22.0) and writing (21.1 against 21.2) are effectively level, so a total-only comparison would conclude that the two groups perform the same, which is true of the total and false of the profile. For a candidate who needs a speaking minimum, that distinction is the one that decides an application.
Speaking is the weak section in most cells. In 16 of the 22 gender-and-purpose cells it is the single lowest of the four section means, and in 2 more it is tied for lowest. All four exceptions sit in the female table, where reading is the lowest section: high-school applicants (reading 19.7), two-year college applicants (18.4), licensure applicants (20.5) and immigration applicants (20.3).
Purpose moves the total more than gender does. For male examinees the range across the ten purposes is 13.8 points, from 76.2 for two-year college applicants to 90.0 for graduate business applicants; for female examinees it is 14.5 points, from 75.5 to 90.0.
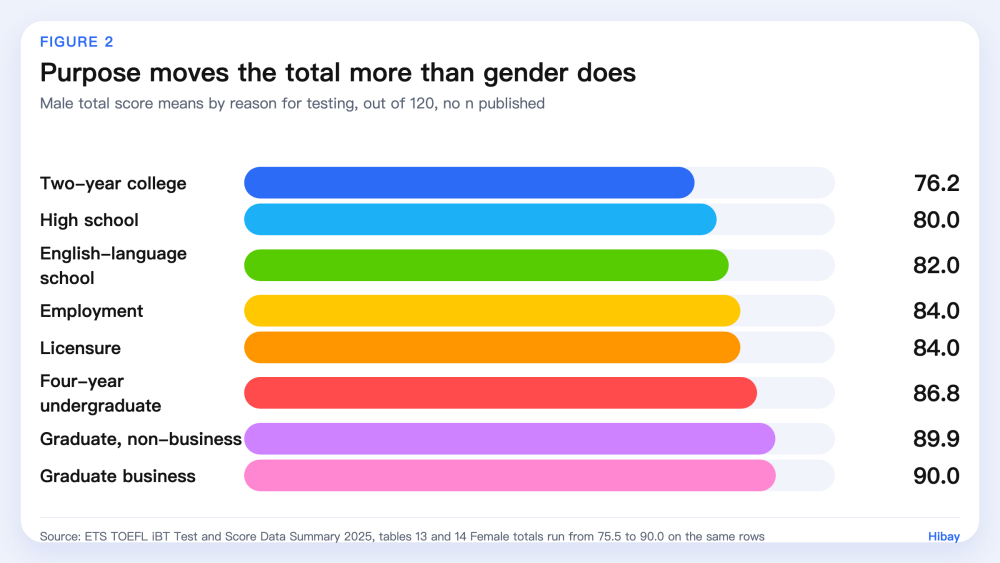
Figure 2. TOEFL iBT total score means by stated reason for testing, male examinees, scores out of 120, n = examinees who answered both questions in 2025. Source: ETS TOEFL iBT Test and Score Data Summary 2025 [1].
| Reason for testing | Male total | Female total | Difference |
|---|---|---|---|
| Two-year college | 76.2 | 75.5 | 0.7 |
| High school | 80.0 | 81.3 | -1.3 |
| English-language school | 82.0 | 81.3 | 0.7 |
| Employment | 84.0 | 84.3 | -0.3 |
| Licensure or certification | 84.0 | 84.0 | 0.0 |
| Four-year undergraduate | 86.8 | 87.8 | -1.0 |
| Graduate, non-business | 89.9 | 90.0 | -0.1 |
| Graduate business | 90.0 | 89.6 | 0.4 |
| Immigration | 85.3 | 83.3 | 2.0 |
Read the last column as male minus female: negative values mean women averaged higher in that group. Every row is a different population of examinees, so the rows should not be read as a progression.
The pattern inside the purposes is not uniform. In four-year undergraduate applicants women average higher overall (87.8 against 86.8), which follows from their speaking mean in that group, while in immigration applicants men average 85.3 against 83.3, a 2.0-point gap that is the widest in the table. Applicants for licensure or certification are level at 84.0 in both groups, and graduate business applicants are level within rounding at 90.0 and 89.6. Because each row is a different self-selected population, none of these differences explains why a group scores as it does.
Limitations
Four limits apply. First, every number here is a mean of a self-selected group: people choose to take the TOEFL and choose what to study, so purpose groups differ in more than purpose, and a high mean for graduate business applicants reflects who applies as much as what the test measures. Second, the tables give no sample sizes, so a purpose row with a few hundred examinees and one with tens of thousands carry the same visual weight, and ETS withholds means for subgroups smaller than 30 in its country tables for exactly this reason. Third, means are rounded to whole numbers, so differences of a point or less, including several in the table above, may be rounding rather than a real gap, and section means do not always sum to the total. Fourth, the gender tables cover only examinees who answered the gender question, so they are a subset of the total group, and nothing here is longitudinal: the file describes one twelve-month window and cannot show whether a gap is widening or closing.
What this means for learners
Check the section minimums, not only the total. If a programme asks for a speaking score as well as a total, a profile with a strong reading score and a weak speaking score can fail a requirement that the total appears to meet, which is exactly the shape the two gender tables show at 85.8. Practise the section your own score report flags rather than the one you enjoy, and practise it out loud, because reading practice does not transfer to a timed spoken response. Hibay offers spoken practice with feedback between tests, though that feedback is not a TOEFL score and does not predict one.
Frequently Asked Questions
Do men and women score the same on the TOEFL iBT? In the 2025 tables they average the same total, 85.8 out of 120, but the profiles differ: men average 22.4 in reading against 21.4 for women, and women average 21.1 in speaking against 20.1 for men (see Results).
Which TOEFL section is hardest? Speaking has the lowest mean of the four sections in the total group at 20.6 out of 30, and it is the single lowest section in 16 of the 22 gender-and-purpose cells in the 2025 tables (see Key findings).
Does the reason you take the TOEFL affect your score? The tables show different means by stated purpose, from 76.2 for two-year college applicants to 90.0 for graduate business applicants, but each purpose is a different self-selected group, so the comparison describes who takes the test for each reason rather than an effect of the reason itself (see Limitations).
How to cite
Hibay Product Team. (2026, November 2). TOEFL iBT 2025: Same Total Score, Different Section Profile. Hibay. https://www.hibay.ai/en/news/toefl-2025-gender-and-purpose
Figures are from the public sources listed below and may be cited with attribution.
References
- ETS. TOEFL iBT Test and Score Data Summary 2025: January-December 2025 Test Data. https://www.ets.org/pdfs/toefl/toefl-ibt-test-score-data-summary-2025.pdf. Accessed 2026-11-02.